⚖️ BMI Calculator (kg/m²)
Calculate your Body Mass Index instantly — supports metric & imperial units
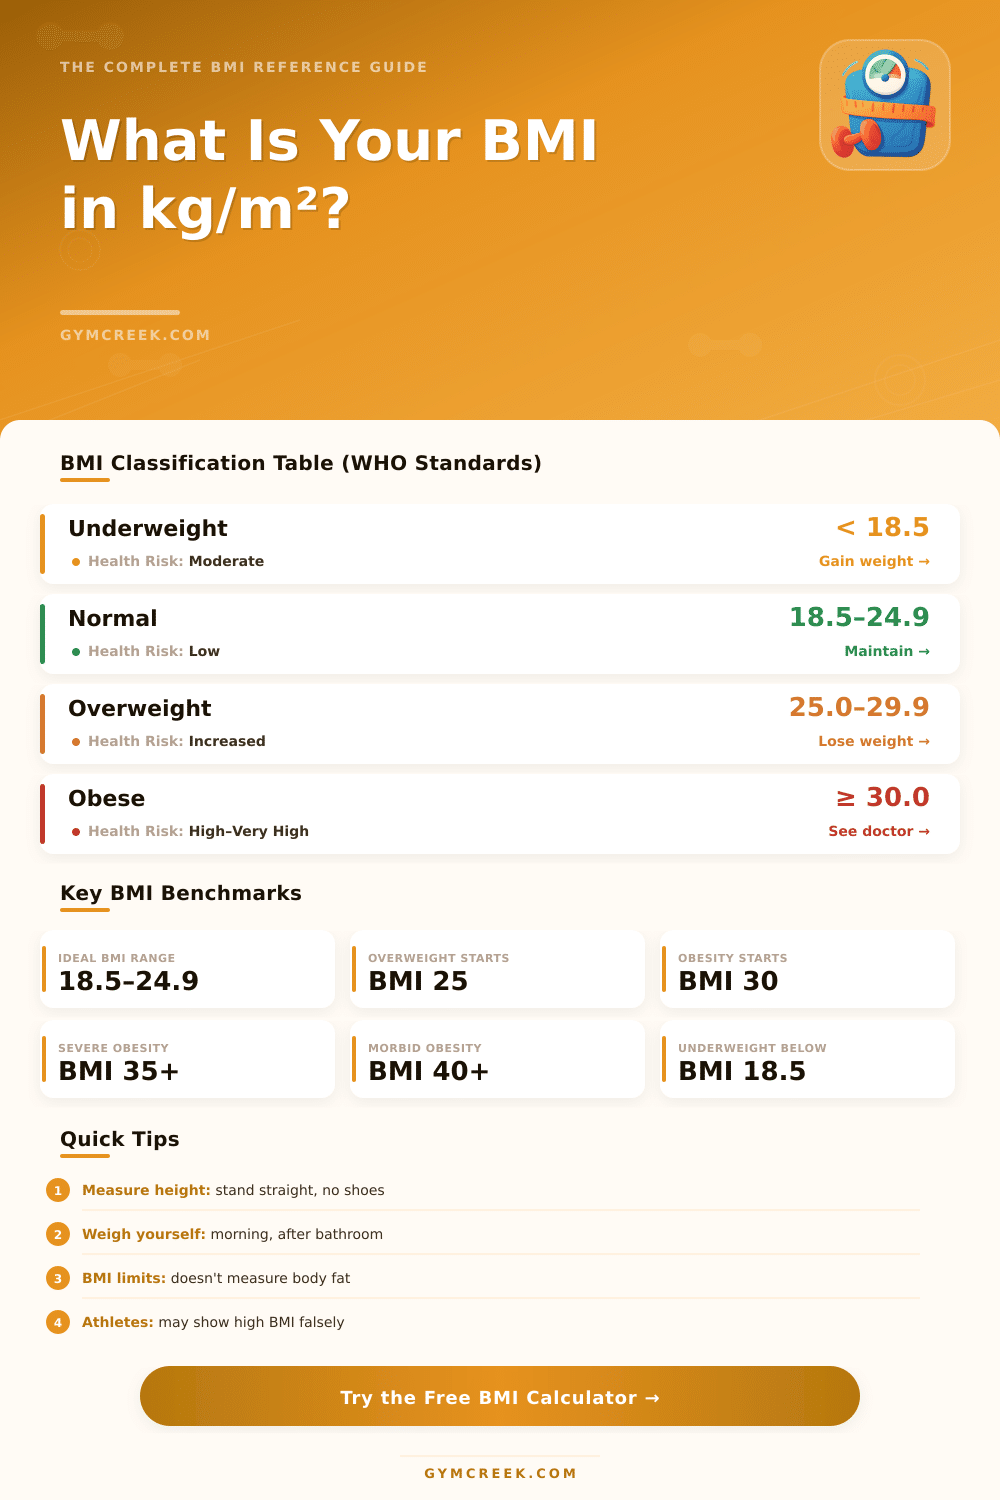
| Category | BMI Range (kg/m²) | Health Risk | Recommended Action |
|---|---|---|---|
| Underweight | < 18.5 | Moderate | Increase caloric intake; see a doctor |
| Normal Weight | 18.5 – 24.9 | Low | Maintain healthy lifestyle |
| Overweight | 25.0 – 29.9 | Increased | Diet & exercise modifications |
| Obese Class I | 30.0 – 34.9 | High | Medical evaluation recommended |
| Obese Class II | 35.0 – 39.9 | Very High | Consult physician urgently |
| Obese Class III | ≥ 40.0 | Extremely High | Immediate medical attention |
| Height (cm) | Height (ft/in) | Healthy Weight (kg) | Healthy Weight (lb) |
|---|---|---|---|
| 150 cm | 4'11" | 41.6 – 56.2 kg | 92 – 124 lb |
| 155 cm | 5'1" | 44.4 – 59.9 kg | 98 – 132 lb |
| 160 cm | 5'3" | 47.4 – 63.9 kg | 104 – 141 lb |
| 165 cm | 5'5" | 50.4 – 68.0 kg | 111 – 150 lb |
| 170 cm | 5'7" | 53.5 – 72.2 kg | 118 – 159 lb |
| 175 cm | 5'9" | 56.7 – 76.5 kg | 125 – 169 lb |
| 180 cm | 5'11" | 59.9 – 80.9 kg | 132 – 178 lb |
| 185 cm | 6'1" | 63.3 – 85.5 kg | 140 – 188 lb |
| 190 cm | 6'3" | 66.8 – 90.2 kg | 147 – 199 lb |
| Group | Underweight | Normal Range | Notes |
|---|---|---|---|
| Adults (18–64) | < 18.5 | 18.5 – 24.9 | Standard WHO classification |
| Older Adults (65+) | < 22.0 | 22.0 – 27.0 | Slightly higher BMI may be protective |
| Asian Adults | < 18.5 | 18.5 – 22.9 | Lower thresholds for metabolic risk |
| Children/Teens | < 5th %tile | 5th – 84th %tile | Age & sex-specific percentiles used |
| Athletes | N/A | May exceed 25 | High muscle mass inflates BMI |
| Pregnant Women | N/A | Pre-pregnancy BMI used | Consult OB/GYN for guidance |
Fat Distribution: BMI does not measure where fat is stored. Abdominal (visceral) fat carries higher health risks than subcutaneous fat, but BMI reflects neither.
Bone Density: People with higher bone density may have a higher BMI without excess fat. Conversely, osteoporosis patients may have a lower BMI that masks health issues.
Ethnic Variations: Research suggests health risk thresholds differ by ethnicity. For example, people of South Asian descent face higher cardiometabolic risk at lower BMI values.
The Body Mass Index, or simply BMI, is a basic way to estimate the fat in the body using only two facts: your height and your weight. It counts for folks of both sexes. The math itself stays quite simple.
DISCLOSURE: This post may contain affiliate links, meaning when you click the links and make a purchase, I receive a commission. As an Amazon Associate I earn from qualifying purchases.

One shares the weight of a folk, said in kilos, by the square of their height in metres. The result appears in kg./m². What one gets helps to give a rough idea about whether some are underweight, have healthy weight, or carry too much extra weight.
What BMI Is and Its Limits
For adults, the BMI sorts itself in groups. Everything under 18.5 points to underweight state. From 18.5 until 24.9 counts as normal weight according to doctors.
Later comes obesity, that starts at 30 or more… And that group splits in three different levels according to the grade of height. For children and youngsters of 2 until 18 years, the method adjusts a bit, because one must also think about age and sex besides the basic measures of height and weight.
The idea of BMI has roots in past research. In 1972, an article by Ancel Keys in the Journal of Chronic Diseases showed, that between many ways to relate weight to height, BMI best catches the share of body fat. Because of the growing obesity in rich western lands, folks started to mind more closely this sign.
But here start the problems: BMI is useful as a screening tool, even though it far is not perfect. It does not measure the fat directly. The problem grows, because it does not consider muscle mass, bone thickness, or the place of the fat on the body.
A person full of muscles can easily seem obese according to the BMI-scale, although they really are slim. Athletes and bodybuilders find that all the time. They have dense bones and lean muscle tissue, what pushes their BMI more highly than they would want.
On the other hand, seniors can seem normal according to BMI, but they carry more fat than you assume, because of loss of muscles during the years. During pregnancy or nursing, the body makeup changes so much, that that simple number of BMI becomes almost pour for rating.
Also, racial and age factors play a role. Black Americans often show different results according to BMI, because higher values can point to muscles instead of extra fat. The safest way is to get a real rating from a medical provider.
The share of body fat helps to give a much more clear sight of your health than only BMI. The ratio of height to waist is another sign, that deserves attention, above 0.5 it shows too much belly fat. There is also the index of body shape, that came about because it focuses on belly fat, that relates more strongly to cancer, heart disease and other serious causes.
On the other hand, high BMI links with bigger risk of death. So, although BMI has its limits, itstays very useful as a way to think about body makeup and general health.