Cycling Power Curve Calculator
Load a named rider profile or your own best efforts from 5 seconds to 60 minutes, then map curve shape, critical power, W', and late-race durability.
📌Presets
Preset numbers are realistic profile-inspired starting points, not official lab files. Swap to your own best efforts for a cleaner curve read.
⚙Power Curve Inputs
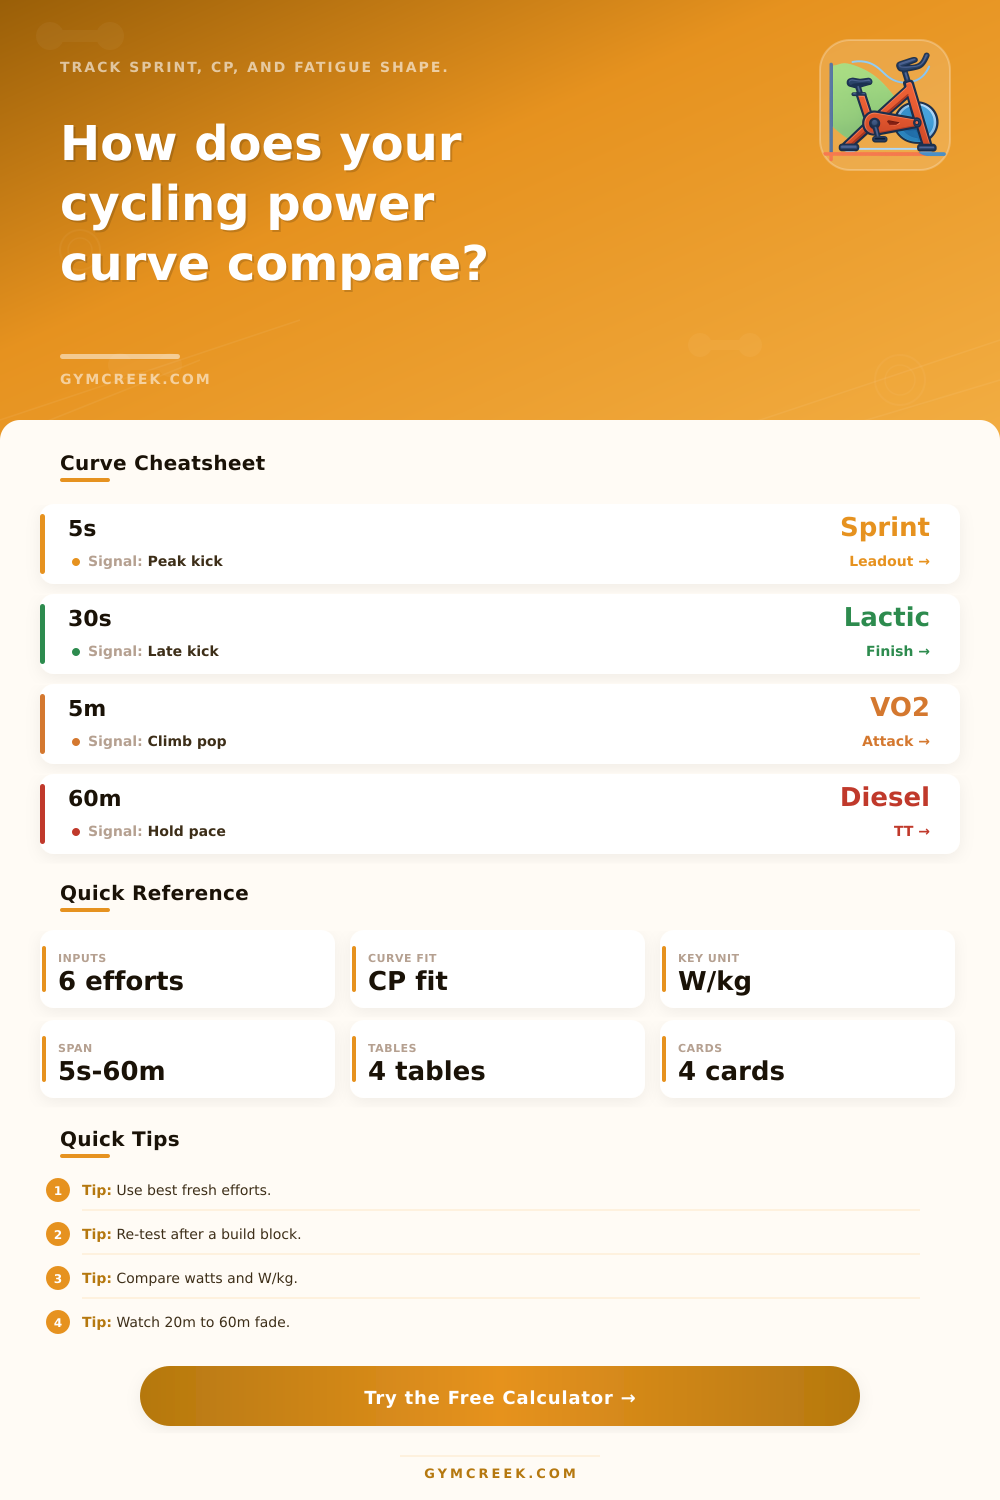
Cycling power curve snapshot
Enter six best efforts to map your curve, estimate CP and W', and judge how much power survives past twenty minutes.
📊Curve Metrics
📑Reference Tables
| Duration | Primary Read | Race Clue | Best Use |
|---|---|---|---|
| 5s | Neuromuscular | Jump snap | Leadout |
| 30s | Lactate punch | Exit speed | Finale |
| 1m | Anaerobic load | Bridge power | Attack |
| 5m | VO2 anchor | Climb pop | Gap close |
| 20m | Threshold | Race pace | Climb/TT |
| 60m | Durability | Late hold | TT/Fondo |
| 60m/20m | Band | Meaning | Cue |
|---|---|---|---|
| <86% | Fades fast | Big drop late | Build Z2 |
| 86-90% | Fair | Needs depth | Tempo work |
| 91-94% | Strong | Good hold | Race ready |
| 95%+ | Elite | Very durable | TT/gravel |
| Curve Type | Shape | Signal | Best Day |
|---|---|---|---|
| Sprinter | High left | 5s rules | Flat crit |
| Puncheur | Sharp mid | 30s-5m pop | Rolling race |
| Climber | Steep right | 5m-60m rise | Long climb |
| TT | Flat right | Low fade | Steady TT |
| Diesel | Stable line | Late hold | Gravel |
| CP W/kg | Band | Race Read | Direction |
|---|---|---|---|
| <3.8 | Base | Build pace | Lift FTP |
| 3.8-4.7 | Club | Solid group | Race local |
| 4.8-5.7 | Fast | Strong field | Target hills |
| 5.8+ | Elite | Front level | Go race |
💡Tips
A power curve represent the power that a cyclist can produce at different durations. While many focuses on their FTP, the power curve show the relationship between short bursts of power and long periods of producing power. The power curve can help a cyclist understands there strengths and how to outpace their competitors during races.
To construct the power curve, a cyclist must produces their maximum power for specific times. The times includes five seconds, thirty seconds, one minute, five minutes, twenty minutes, and sixty minutes. Each time interval indicate a different physiological system within the body.
What a Power Curve Tells a Cyclist
For instance, five second efforts indicate the strength of a cyclist’s neuromuscular system as they sprint for short distances. Thirty-second efforts indicates a riders ability to take in lactate as they ride in corners or respond to other riders’ attacks. One-minute efforts indicate anaerobic capacity and five-minute effort indicate a riders VO2 max. Twenty-minute and sixty-minute efforts indicates there aerobic system and threshold power.
The fatigue score come from analyzing a riders power at twenty minutes and sixty minutes. If the power output at sixty minutes is less than 86% of the power at twenty minutes, that indicate that the power curve fade quickly. Between 91% and 94% of the power at twenty minutes indicate that the cyclist is ready for the race.
Cyclists who can maintain 95% or more of their power at twenty minutes to sixty minutes is considered to be elite cyclists. The critical power in the power curve model represents the maximum wattage that a person can sustain without depleting there anaerobic energy reserves. Additionally, the model use W’ or W-prime, which is the finite amount of energy that a person can utilize above there critical power.
Another value is watts per kilogram, which allow for the comparison of the power output of riders of different weights. For instance, it is possible to compare the power of a 66kg cyclist to a heavier cyclist using this value. The shape of a riders power curve indicates there cycling style.
Sprinters produce high outputs of power but fade quick. Puncheurs maintain high levels of power from thirty seconds to five minutes. Climbers and time trialists maintain there power for longer periods, allowing them to maintain there power even when other cyclists cannot maintain theirs.
All-rounders has strengths in all areas of power. To ensure the cyclists power curve is accurate, the rider should perform the tests while they is fresh. If the rider is fatigued, there power curve will not be accurate.
Additionally, all tests should use the same equipment and take place in the same environment to allow the power curve to be tracked over time. Additionally, because watts per kilogram incorporates the weight of the cyclist, the rider must also be accurate in measuring there body weight. Beyond showing a cyclist there strengths, a power curve can help them prepare for races.
For one, it can highlight which physiological systems need further training. It can also allow a cyclist to prepare there power curve for races by understanding how much power they can produce before reach exhaustion.