📊 Body Mass Index 3D Calculator
Calculate your BMI, visualize your body profile in 3D, and explore healthy weight ranges for your height and gender
| BMI Range | Category | Health Risk | WHO Classification |
|---|---|---|---|
| Below 16.0 | Severely Underweight | Very High | Grade III Thinness |
| 16.0 – 17.0 | Moderately Underweight | High | Grade II Thinness |
| 17.0 – 18.5 | Mildly Underweight | Moderate | Grade I Thinness |
| 18.5 – 24.9 | Normal Weight | Minimal | Normal range |
| 25.0 – 29.9 | Overweight | Increased | Pre-obese |
| 30.0 – 34.9 | Obese Class I | High | Obese Class I |
| 35.0 – 39.9 | Obese Class II | Very High | Obese Class II |
| 40.0 and above | Obese Class III | Extremely High | Obese Class III |
| Age Group | Male Normal BMI | Female Normal BMI | Notes |
|---|---|---|---|
| 5 – 12 years | 14.0 – 20.0 | 13.5 – 20.5 | Use CDC growth charts |
| 13 – 17 years | 16.5 – 24.5 | 16.0 – 24.0 | Adolescent adjustment |
| 18 – 24 years | 18.5 – 24.9 | 18.5 – 24.9 | Standard WHO range |
| 25 – 34 years | 18.5 – 24.9 | 18.5 – 24.9 | Standard WHO range |
| 35 – 44 years | 19.0 – 25.5 | 19.0 – 25.5 | Slight upward shift |
| 45 – 54 years | 19.5 – 26.0 | 19.5 – 26.0 | Muscle mass decline |
| 55 – 64 years | 20.0 – 26.5 | 20.0 – 27.0 | Higher fat at same BMI |
| 65+ years | 22.0 – 27.0 | 22.0 – 27.0 | Slightly higher is protective |
| Height | Min Weight (lbs) | Max Weight (lbs) | Min–Max (kg) |
|---|---|---|---|
| 5’0" / 152 cm | 97 lb | 128 lb | 44 – 58 kg |
| 5’2" / 157 cm | 104 lb | 135 lb | 47 – 61 kg |
| 5’4" / 163 cm | 110 lb | 144 lb | 50 – 65 kg |
| 5’6" / 168 cm | 118 lb | 154 lb | 54 – 70 kg |
| 5’8" / 173 cm | 125 lb | 164 lb | 57 – 74 kg |
| 5’10" / 178 cm | 132 lb | 174 lb | 60 – 79 kg |
| 6’0" / 183 cm | 140 lb | 183 lb | 64 – 83 kg |
| 6’2" / 188 cm | 148 lb | 194 lb | 67 – 88 kg |
| 6’4" / 193 cm | 156 lb | 205 lb | 71 – 93 kg |
Physical Body Mass Index, or BMI, is made up of a number derived from the height and weight of people. It serves to check whether someone has weight in a healthy limit. The calculation itself is very easy.
DISCLOSURE: This post may contain affiliate links, meaning when you click the links and make a purchase, I receive a commission. As an Amazon Associate I earn from qualifying purchases.

One shares the weight in kilos by the square of the height in metres. The result appears in kg./m². It works for adult people both men and women, and works well as a screening method for guessing the amount of body fat.
What Is Body Mass Index (BMI)?
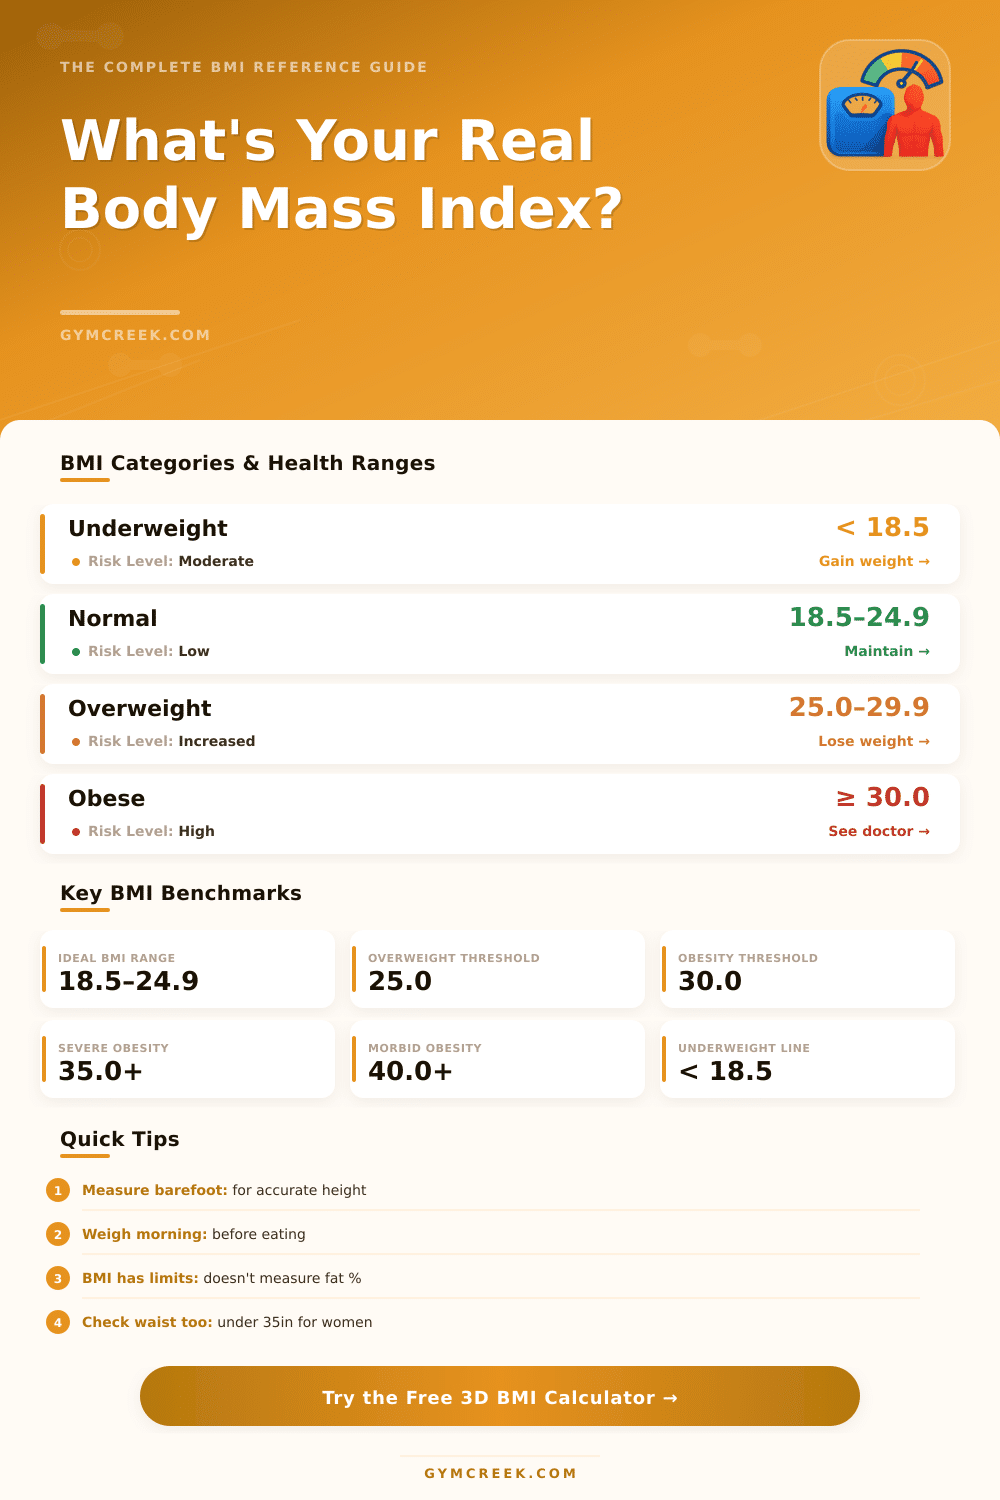
BMI values are split into separate groups. A number under 18.5 points to an underweight state. From 18.5 to 24.9 one considers normal or healthy range.
Above that one talks about obesity, which starts at 30. Obesity on the other hand splits into three grades. For children and young people from 2 to 18 years, the calculation also includes age and gender.
The name “Body Mass Index” spread after an article appearing in 1972 in the Journal of Chronic Diseases by Ancel Keys. This study found that BMI is the best relation between weight and height for guessing the percentage of body fat. The worry about body thickness grew, because obesity became a visible problem in wealthy western lands.
The core of the formula itself comes from the 19th century, when one called it the Quetelet-Index.
BMI works as a good screening method, but not as a diagnosis tool. It does not directly measure body fat. It also does not consider muscle volume, bone density or the spread of fat in the body.
Here this is its main weakness. People with a lot of muscles can land in the overweight group, although there fat is little. Bodybuilders form a typical case.
More than 25 % of male sportsmen classify as overweight according to BMI, while only under 4 % have truly too much body fat.
Older adults commonly have normal BMI, but more body fat because of loss of muscles. Pregnancy and nursing alter the body makeup, so that BMI does not truly help here. BMI varies according to ethnic background.
For African Americans it commonly overly marks obesity, because the bigger value comes from muscle mass instead of extra fat.
The percentage of body fat gives a safer sign about whole health than only BMI. The relation between height and waist is also suggested as a better marker. The safest way to hear about BMI and its meaning is a trip to a medical helper.
BMI stays useful for the whole population as a starting base. High BMI relates to bigger risk of death. Even so it forms only one part of the jigsaw andrequires combining with other ratings for a complete picture.