TSS Calculator Cycling
Estimate bike training stress from FTP, ride duration, intensity factor, normalized power, and weekly load context.
📌Presets
Each preset loads a realistic cycling file and recalculates TSS, IF, normalized power, and weekly training load.
⚙Calculator
Cycling TSS snapshot
Enter FTP, duration, and intensity to estimate training stress.
📊Training Snapshot
📑Reference Tables
| IF Band | Typical Feel | Power Zone | Common Use |
|---|---|---|---|
| 0.45-0.55 | Very easy | Recovery | Low stress spin |
| 0.56-0.75 | Controlled | Endurance | Base mileage |
| 0.76-0.87 | Moderate | Tempo | Aerobic build |
| 0.88-0.94 | Firm | Sweet spot | Quality work |
| 0.95-1.05 | Hard | Threshold | FTP sessions |
| 1.06+ | Very hard | VO2 or race | Short intense work |
| Ride TSS | Load | Recovery Cue | Example |
|---|---|---|---|
| 0-50 | Light | Often same day | Easy spin |
| 51-100 | Moderate | Normal next day | Base ride |
| 101-150 | High | Watch fatigue | Tempo long ride |
| 151-250 | Very high | Plan recovery | Race or century |
| 250+ | Extreme | Several easy days | Big endurance day |
| Input Mode | Best When | Formula Path | Watch Out |
|---|---|---|---|
| Known IF | Planning workouts | NP = FTP x IF | Needs realistic IF |
| Known NP | After ride files | IF = NP / FTP | FTP must be current |
| Average + VI | Rough estimates | NP = Avg x VI | VI is an estimate |
| Target TSS | Session design | Hours = TSS / IF2 / 100 | Intensity affects time |
| Scenario | Duration | IF | Approx TSS |
|---|---|---|---|
| Recovery spin | 45 min | 0.50 | 19 |
| Base ride | 2 hr | 0.65 | 85 |
| Sweet spot | 75 min | 0.90 | 101 |
| Threshold test | 60 min | 1.00 | 100 |
| Long event | 5 hr | 0.72 | 259 |
💡Tips
This metric converts our personal experience into something real (data). Instead of blindly training harder, we can train smarter.
Training Stress Score measure the physical stress you take from your workouts. Sometimes you feel wrecked for two days after crushing a ride, other times you spend three hours spinning around in Zone 2 without breaking much sweat. It’s not all about time on the bike, the real difference is how much physical stress your body experience.
How Training Stress Score Works
And there’s also the idea of Functional Threshold Power (FTP) and duration of your rides. Your FTP is roughly your ability to maintain a specific level of power for about an hour of riding. In other words, it becomes a personal measurement of exertion. By multiplying your time in the saddle by a fraction of how much harder it was then your FTP, you get a meaningful number. The calculator do all the math quickly.
It helps you know if your workout was productive or not; junk miles or not.
A lot of folks has trouble with Intensity Factor. It seems so straight forward: divide your average power by your FTP. But on the road you don’t ride straight and level all day. You deal with drafting, sprints, climbs, and coasting. When you’re doing these things average power tell you a lie. The sudden surge raises your heart rate but average doesn’t count that and therefore underestimates how much glycogen you burn off.
That’s why there is Normalized Power as an input option. It weighs each effort based off its bodily cost relative to a steady grind and thus produces a stress score which reflect your actual post-ride fatigue. To change inputs, simply click between your various modes based on what you’re tracking. Plugging in Normalized Power are much more accurate if you’ve just completed a long hilly group ride or crazy criterium. But if you have a planned ride and want to see how much effort your body can handle at an 80 percent intensity factor, it makes sense to enter that as target. For non-power meter users with nothing but average power data, the variability index setting fill this gap, estimating additional stress from inconsistent pace.
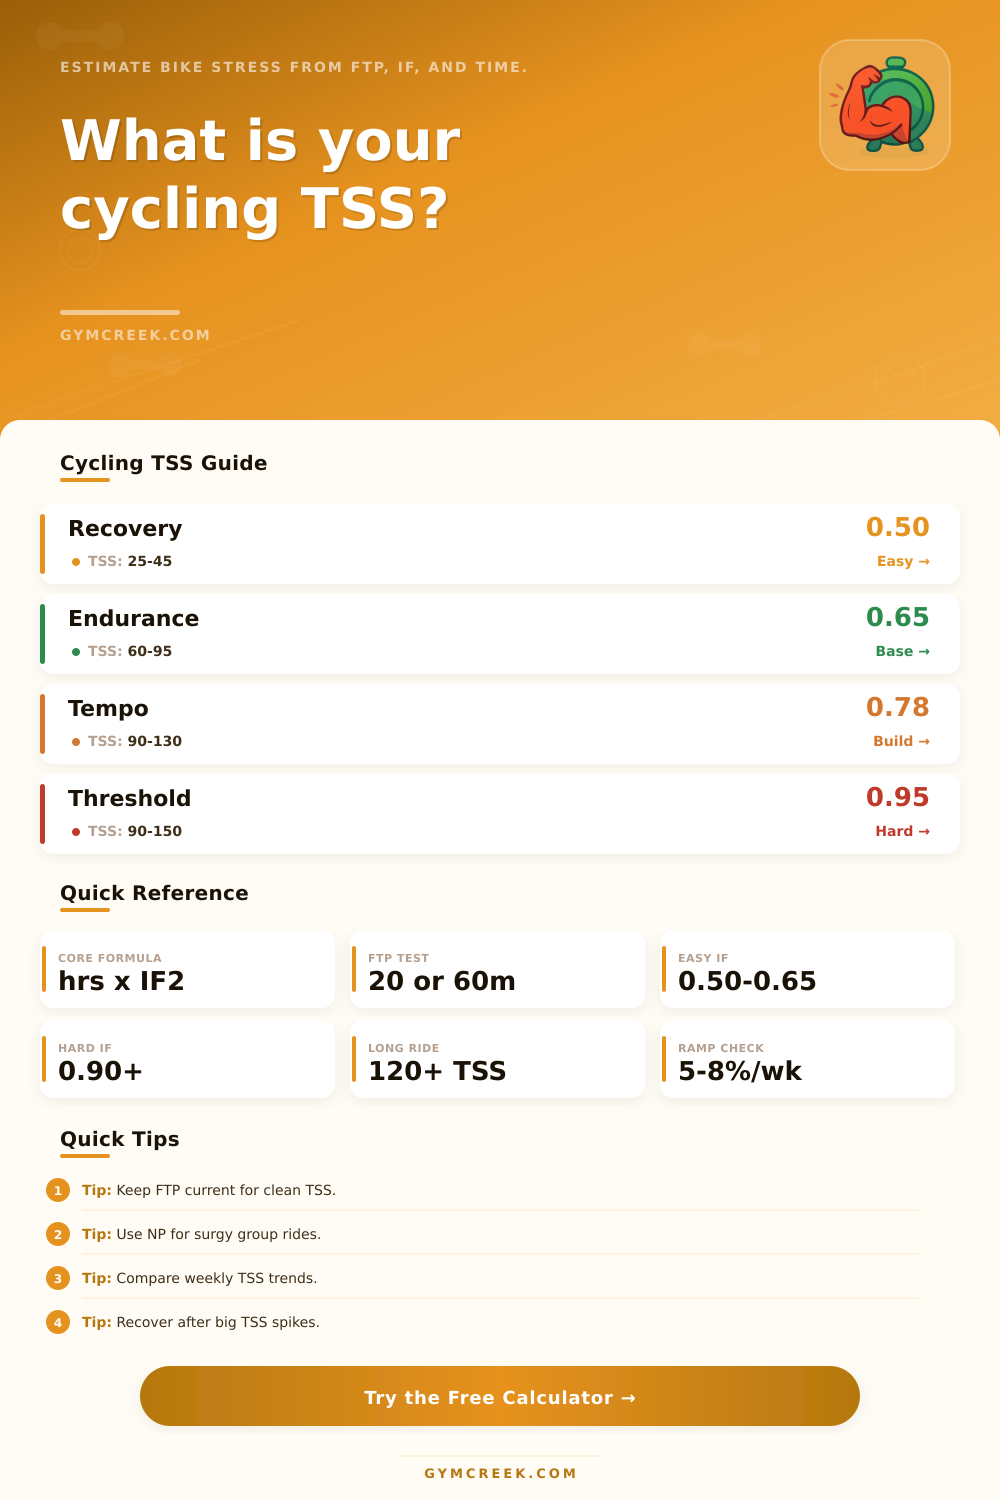
You don’t want that when you are recovering from a hard workout and trying to prevent overtraining. So what do you get out of it? These are points (TSS). Points is a currency of training load; they apply to everyone, universally. A moderate recovery spin may produce 25 points. A tough threshold session might reach upwards of 100. Depending on the band of intensity, your TSS goal matches certain physical goals, which can be seen in reference table on the page.
Try to manage your weekly totals and don’t let them jump dramatically. Instead, make small incremental increases. Spike your TSS by 30 percent in a week because you were feeling good? Your body won’t necessarily agree with that enthusiasm come Monday morning. Keep in mind that this is all relative. If you’ve been off the bike through winter, 120 might be pretty easy, but if you’re an experienced racer, that’s a different story.
Additional fields allow you to plug in your planned load (the number of times per week you’ll do the same session) to help you predict how your body will feel from one week to the next. That way, you get a sense of the overall accumulation of fatigue. You won’t stack three tough days together without thinking about recovery time. Your legs can only adjust so quickly. You also can’t skip sleep if you hope those points result in any fitness gain.
The numbers have a way of getting under our skin. We can get fixated on them like they’re high scores for a video game. But only if we adapt to training stress do we become better acclimated to it, and only then if we give ourselves recovery time. Let the tool guide you so that your hard days are truly hard and your easy days is indeed easy.
That’s why polarized training works. It strikes a balance at each end of the spectrum. It is not because you can rack up an endless number of points. By the end of a long season when the dust settles, the highest TSS day won’t be the one that matters most. The difference maker will be how consistently you listen to what those numbers say about your limits.