Triathlon Transition Time Calculator
Estimate T1, T2, total transition time, movement pace, setup delays, practice savings, and race-day buffer from transition layout, gear choices, skill level, fatigue, and race format.
📌Transition Presets
Presets load realistic transition layouts and gear choices. Change the distances and setup details to match your actual race map.
⚙Athlete, Layout, and Gear Inputs
Transition snapshot
Enter your transition layout and gear choices to estimate T1 and T2.
📊Transition Metrics
📑Reference Tables
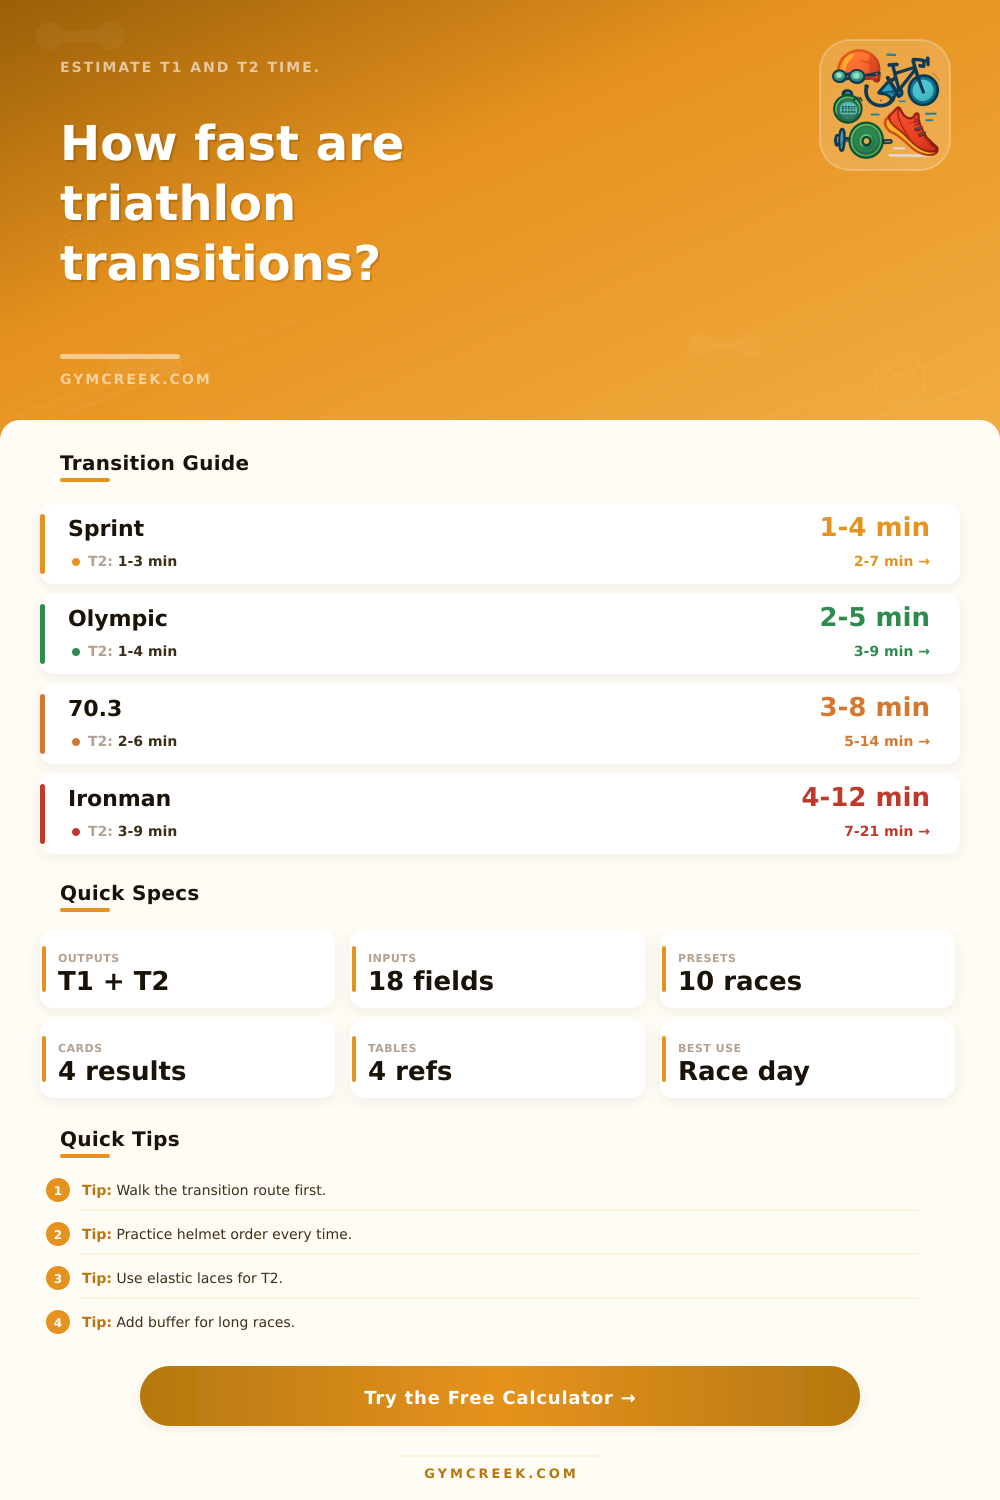
| Format | Typical T1 | Typical T2 | Context |
|---|---|---|---|
| Sprint | 1-4 min | 1-3 min | Short race, high time value |
| Olympic | 2-5 min | 1-4 min | Longer racks and bigger fields |
| 70.3 | 3-8 min | 2-6 min | More gear and nutrition handling |
| Full distance | 4-12 min | 3-9 min | Changing areas and fatigue matter |
| Component | Fast | Steady | Watch point |
|---|---|---|---|
| Wetsuit off | 20-35 sec | 45-75 sec | Sticky ankles add time |
| Helmet and bike | 10-18 sec | 20-35 sec | Helmet before touching bike |
| Bike shoes | 0-15 sec | 20-45 sec | Clipped shoes need practice |
| Run shoes | 10-20 sec | 25-45 sec | Elastic laces reduce delay |
| Choice | Time effect | Risk | Best use |
|---|---|---|---|
| No socks | Fastest | Blisters | Short races or trained feet |
| Shoes on bike | T1 faster | Mount errors | Experienced athletes |
| Cold layers | Slower | Lower chill | Cold or long races |
| Regular laces | Slower T2 | Secure fit | New athletes or rough runs |
| Formula | Variables | Output | Use |
|---|---|---|---|
| Movement time | Distance / pace | Travel seconds | Transition-zone layout |
| Action model | Gear x skill | Setup seconds | Rack and equipment work |
| Practice model | Skill and reps | Time savings | Training target |
| Mifflin-St Jeor | Age, sex, size | BMR | Fitness context only |
💡Tips
Transitions are easy … right? Until you find yourself standing in a tent with 20 other people. Your heart rate hasn’t even slowed yet and it’s time to remove wetsuit. This first transition after swimming really establish how the rest of the day go. That applies as much to bike-to-run transition. Most triathletes spends so much time looking at their swim, bike, and run splits, but what happens during transitions can be the difference between a controlled race and a chaotic one.
Transition isn’t just about managing equipment; it’s about fatigue, decision points and distance covered between them. A rack that sits farther from the swim exit force more running in bare feet. A misplaced helmet under a towel equals more seconds lost for hundreds of athlete. And while impact may be small early on, as you get tired these little things adds up to produce bigger gaps in transition time among similarly skilled athletes. So, even if two people is similarly skilled, we will see larger gaps in their transitions in long races.
How to Improve Your Triathlon Transitions
Once you input your real-life gear selections and distances, the calculator do the math. It breaks out action time vs. Movement time, allowing you to determine which is the larger limiting factor: your set-up or your layout? There are genuine tradeoffs associated with sock plans (socks protect bare feet during long run, but add a step that some slower athletes neglect with no adverse effect). Bike shoe placement matter. Clipped shoes can saves time, as long as the mount is practiced and permitted. Wetsuit type matters too.
Many underestimate how important skill are. An inexperienced person who spends time practicing a routine can easy outpace a seasoned pro who never even thinks about transitions. This is where the practice variable comes into play in the tool, how long does it take you to repeat the order enough that it becomes second nature? Many athletes misses this piece entirely, thinking that it’s all about the gear and not repetition.
There’s another factor that can change the equation: fatigue. If you’re already feeling tired going into T2, everything is slower, including basic movements such as clipping on your race belt or buckling your shoes. Again, though, the calculator account for this, but there are other variables in any given race day that just won’t be captured. Suddenly everyone crowd the rack. Or something goes wrong with your equipment. These moments is what a little buffer (even for experienced athletes) is good for.
So the numbers here aren’t targets but more of guard rails. Six minutes in transition could of been just fine in a full-distance race where there’s changing conditions, extra gear, etc., but it might mean you have extra time to spare in a sprint event. The number to use as a guide for what normal looks like from format to format is provided in the tables on the page.
But in truth, that’s where the benefit lie; it takes guesswork out of race day. It helps you determine what decisions you need to practice now and which ones you can keep simple. That focus make your transition less stressful and more a part of the plan.