Training Strain Calculator
Estimate weekly training strain from daily load spread, monotony, session count, recovery quality, sport context, and prior week change so the week can be read as a full pattern instead of one total.
📌Presets
Daily load can be sRPE load, TSS, tonnage, minutes, distance, or another consistent internal load score. Keep the same scale across the current and prior week.
⚙Calculator Inputs
📅Daily Load Spread
Training strain snapshot
Enter daily loads, prior week load, and recovery context to calculate the weekly strain profile.
📊Metrics Grid
📑Reference Tables
| Strain | Signal | Common Pattern | Training Call |
|---|---|---|---|
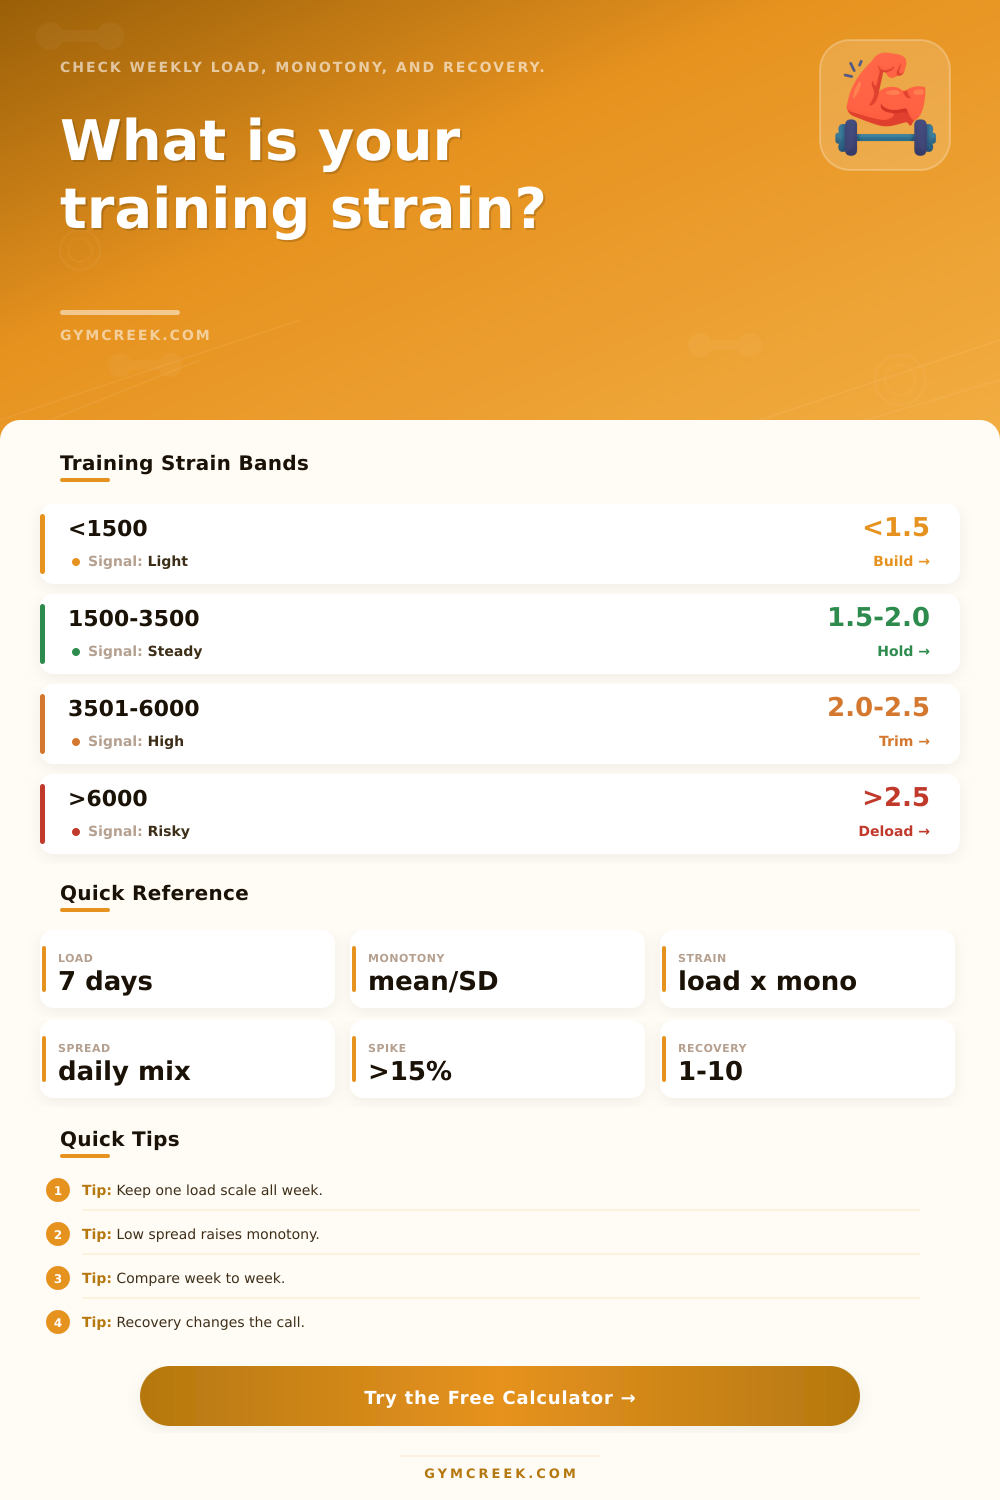
| <1500 | Light | Low exposure | Build gradually |
| 1500-3500 | Steady | Manageable week | Hold plan |
| 3501-6000 | High | Heavy block | Protect recovery |
| >6000 | Very high | Dense stress | Deload or split |
| Monotony | Meaning | Daily Spread | Watch |
|---|---|---|---|
| <1.50 | Varied | Good contrast | Progression |
| 1.50-2.00 | Moderate | Some sameness | Hard days |
| 2.01-2.50 | High | Flat loading | Recovery debt |
| >2.50 | Very high | Low variation | Illness risk |
| Week Change | Signal | Interpretation | Action |
|---|---|---|---|
| <-15% | Drop | Deload or missed work | Rebuild |
| -15% to +10% | Stable | Normal variation | Continue |
| +11% to +20% | Jump | Noticeable ramp | Check readiness |
| >+20% | Spike | Aggressive change | Reduce next load |
| Sport | Load Focus | Spread Issue | Extra Context |
|---|---|---|---|
| Running | Distance / TRIMP | Long-run share | Surfaces |
| Field sport | sRPE / GPS | Match stacking | Sprints |
| Gym | Tonnage / RPE | Heavy day share | Joint stress |
| Court sport | Minutes / RPE | Tournament density | Lateral work |
🧮Formula Notes
| Metric | Formula | Use | Limit |
|---|---|---|---|
| Weekly load | Sum days | Total exposure | Scale dependent |
| Monotony | Mean / SD | Load sameness | Zero SD edge |
| Strain | Load x mono | Week stress | Needs context |
| Spread score | Variation mix | Pattern read | Not diagnosis |
| Recovery | Sleep | Modifier | Meaning |
|---|---|---|---|
| 8-10 | 8-10 | Normal | Fresh |
| 6-7 | 6-7 | Watch | Manageable |
| 4-5 | 4-5 | Caution | Flat |
| 1-3 | 1-3 | High caution | Poor |
💡Tips
To understand what training strain means to you requires knowing how evenly you distributed that work during the week. It also require knowing how hard you worked. A runner who logs the same moderate effort every day can finish the week feeling flat. The athlete who has mixed in some realy hard days with actual rest days can often recover better despite having a higher-looking overall workload.
Why? Because that monotony, the statistical sameness of your daily loads. Matter. And it shows how sleep and recovery do one of two things: increase (or lessen) monotony.
How Training Strain Works
Inputs to the picture are shaped by what the calculator asks for. A field sport athlete preparing for multiple matches will deal with different stressors than a cyclist facing back-to-back high TSS days or a powerlifter balancing joint load. This is why context of the sport is important.
Keeping the math honest is about the load scale. When you combine tonnage or distance with session RPE, it distorts things if you mix units during the week. Knowing the training phase allows the tool to recognize when a big week is just part of normal progression. It also know when to flag a week as needing special attention. For example, peak week and a return-from-break week will each get flagged despite having a similar total.
Load matters more then you might think. There’s a point where one super-heavy day will increase monotony more than everything in the entire week combined (and that’s what the calculator factors in: How much are you carrying on the worst day?). Then there’s session count and rest days. Seven sessions without any time off is different than spreading out five sessions over five days with two true off days, and that is even before considering recovery scoring.
The last signal is shifted by recovery and sleep scores (since they alter what that same strain number equates to in real life). So you can have an awesome recovery score and maybe get away with a higher strain week, while a moderate week paired with poor sleep often mean you need to pay attention earlier next week. Then it layers on the week-to-week comparison. If I’m already struggling with recovery and the number jump up significantly compared to previous week, there’s a greater risk.
But if you scroll down to the reference tables on the page, you’ll see that they lay out common bands for monotony and strain so you can identify where your result falls: Is it in the high, steady, light, or risky zone? Those bands aren’t rules. Rather, they’re conversation starters: Do I need to add some contrast to my week by varying easier/harder days? Should I keep my volume the same? Or would a deload be the smarter move?
It’s the multiple-week comparison that seems truly useful, it reveals patterns obscured by a single number. You begin to see that your top-performing blocks has just enough monotony, paired with good recovery, or perhaps they can withstand greater strain as long as they’re sandwiched between rest days. The calculator just makes it easier for you to see these patterns more quickley than you could of do in your head.