T-Test Agility Calculator
Estimate adjusted T-test time, lateral shuffle speed, change-of-direction efficiency, and benchmark band from split times, surface, timing method, penalties, and athlete size.
📌Presets
Presets load complete split patterns so you can compare sharp lateral movers, bigger athletes, field surfaces, and controlled return-to-play testing.
⚙Calculator
T-test agility snapshot
Enter total time and split times to calculate adjusted agility metrics.
📊Agility Metrics Grid
🧮Formula Cards
Adjusted Time
adjusted = total + timing - surface + penaltyLateral Speed
lateral speed = 18.288 m / lateral secondsCOD Efficiency
COD = (split sum / adjusted) x balanceAgility Score
score = weight lb x 100 / adjusted^2📑Reference Tables
| Profile | Excellent | Competitive | Needs Work |
|---|---|---|---|
| Court sport athlete | Under 9.8 sec | 9.8–10.8 sec | Over 11.8 sec |
| Field sport athlete | Under 10.0 sec | 10.0–11.2 sec | Over 12.2 sec |
| Football skill player | Under 9.7 sec | 9.7–10.7 sec | Over 11.7 sec |
| Football big skill | Under 10.4 sec | 10.4–11.5 sec | Over 12.6 sec |
| General fitness | Under 11.5 sec | 11.5–13.0 sec | Over 14.0 sec |
| Segment | Distance | What It Shows | Fast Marker |
|---|---|---|---|
| Forward sprint | 10 yd / 9.14 m | Start and approach | 1.60–1.85 sec |
| Left shuffle | 5 yd / 4.57 m | First brake and push | 1.00–1.25 sec |
| Right shuffle | 10 yd / 9.14 m | Lateral rhythm | 1.95–2.30 sec |
| Center return | 5 yd / 4.57 m | Second brake control | 1.00–1.25 sec |
| Backpedal finish | 10 yd / 9.14 m | Hip control and finish | 1.85–2.25 sec |
| Timing Or Surface | Adjustment | Best Use | Caution |
|---|---|---|---|
| Laser gate / electronic | 0.00 sec | Official comparison | Gate height matters |
| Video reviewed | 0.08 sec | Training sessions | Frame choice matters |
| Hand timed | 0.24 sec | Informal testing | Reaction bias is large |
| Court or rubber floor | 0.00 sec | Neutral baseline | Check cone spacing |
| Dry grass | -0.12 sec | Field sport testing | Traction changes |
| Scenario | Expected Pattern | Watch First | Retest Clue |
|---|---|---|---|
| Fast total, weak left split | One-side brake limit | Plant angle | Bias shrinks |
| Good lateral, slow backpedal | Late finish leak | Hip height | Back split drops |
| Slow total, even splits | General speed limit | All segments | Total drops together |
| Big total gap vs splits | Timing or path issue | Cone route | Gap tightens |
💡Tips
Standard agility drills like the T-test force players to sprint forward, then shuffle to the side, then backpedal again, then turn around, so they must change directions randomy just as they do in game situations. But raw time isn’t enough. If I finish in 10 seconds, that’s one thing if you timed me with a slow stopwatch. It’s another thing if we did it on hardwood floors instead of wet grass. Context is everything here. How do you isolate what was realy your athletic output, apart from all those variables?
Well, the calculator up there does that work for you. It factors out the reaction delays and surface friction so you can compare your last training workout to your next one without any guesswork. I see a lot of guys who think it’s all about total time, and that’s where they go wrong. Total time is just the accumulation of five different movements.
How to Use the Agility Calculator
Acceleration are tested during the forward sprints. Stride control and visual awareness is tested during the backpedal. Balance and hip mobility are tested during the lateral shuffles. By breaking down split times, you begin to see where your weakness are, things a total score might mask. Let’s say you have a really quick forward sprint and then slow lateral shuffles. That would indicate solid speed but weak deceleration skills. You run great, but can’t effectively change directions or come to a stop. This breaks it down into how fast laterally you move and whether you’re efficient changing direction or not. Are you balanced? Do you lose time in one particular area?
Then there’s what most folks don’t think about: Surface correction. Whether it’s running on loose dirt or dry grass, you’re slowing yourself down with increased drag and decreased stability. To make the comparison apples-to-apples (pun intended), the calculator normalizes your test to a neutral starting point, typically a rubber floor or hard court. Then the calculator can give you a fair comparison. If you did one test on grass but next on turf, then obviously you wouldn’t line up raw times from each month. So adjusting for surface takes out that variable.
And the tool also considers your timing. Laser gates are a bit more precise than hand timing, adding about a quarter-second of buffer because we’re all humans with some reaction time. That’s why that adjustment helps level the playing field so you’re comparing efforts not equipment.
What’s cool about it: Penalties do make a difference, more than you’d expect. Slipping, crossing over a step, touching a cone…these aren’t just lapses in technique; they’re milliseconds off your clock. By incorporating penalties into your time, you can see what your time would of been without them. Even if the athlete’s equally fit, a clean run takes less time than a sloppy one. You can plug in your mishaps and find out how long it would’ve taken without them.
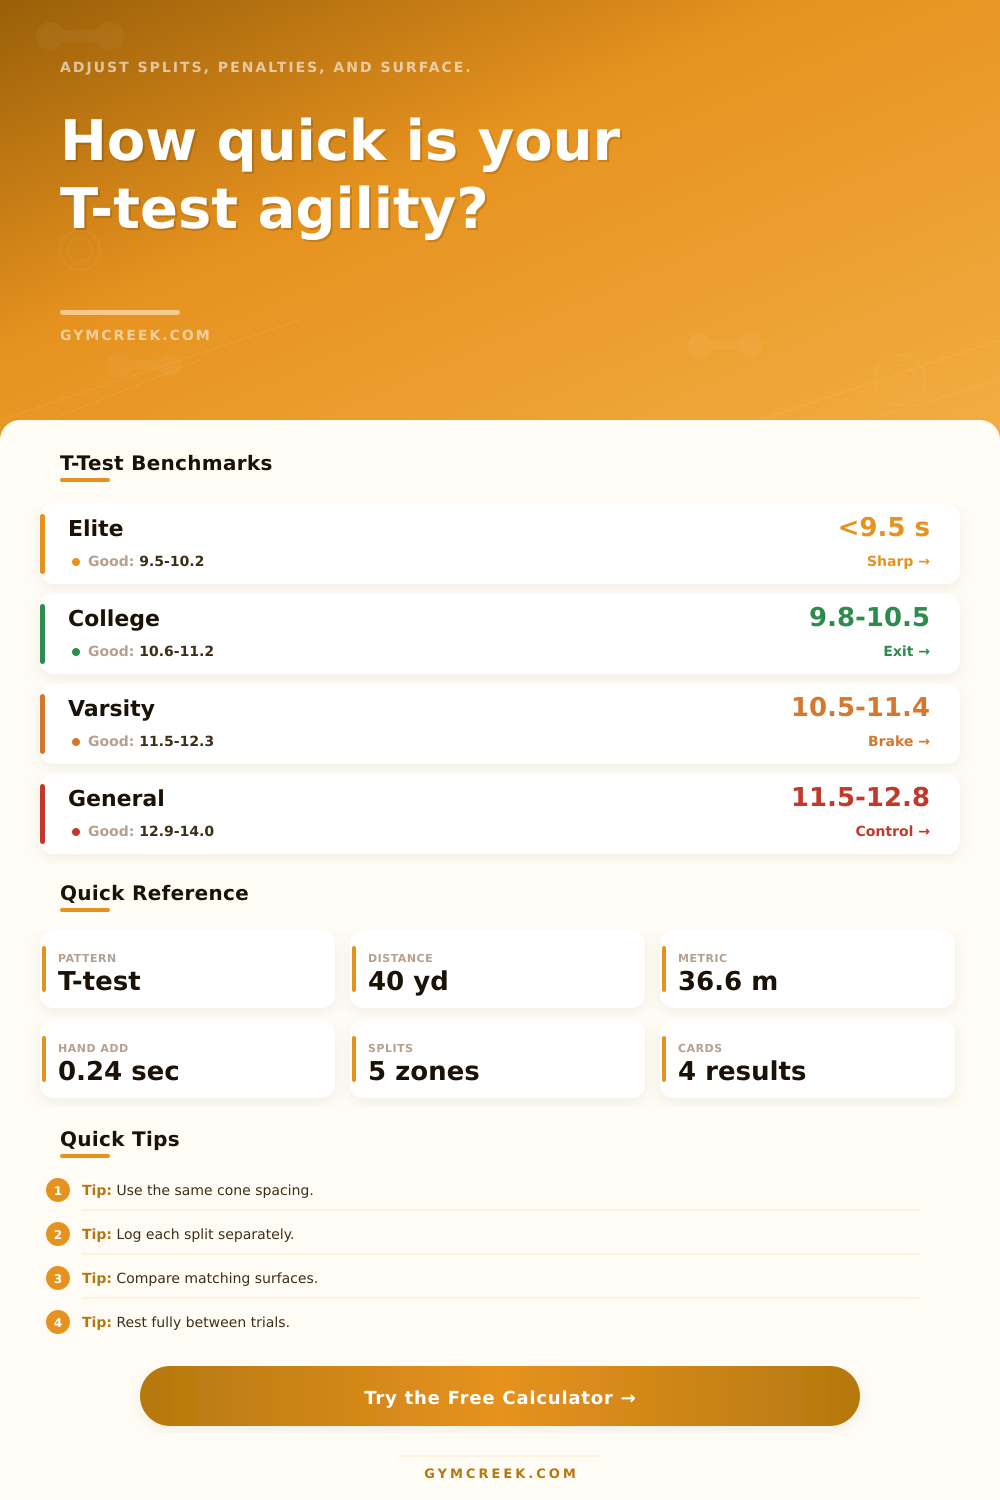
It then calculates mass-adjusted score (taking into account body weight). More inertia means heavier athletes needs more control and power. By considering this factor, it provides a truer reflection on their relative control and power. On the page there’s a chart with benchmark times for various ages and sports. A college athlete may clock in at ten or eleven seconds; an elite player often hits the nine and a half-second mark or lower. Those times aren’t judgments but targets. View them as goals, not judgments. Don’t expect a high school quarterback to run as fast as a pro cornerback. Improvement is what matters here.
So what about the splits? Can you trim two-tenths of a second from your lateral shuffle? That’s something you can work toward. When parts get better, so does total time. The last indicator of readiness is consistency. Luck gets you one quick run. Skill gets you three quick runs. With the calculator, you can enter several runs. Then you can see how consistent you’ve become.
If your times fluctuate widely, chances are either you’re tired or your technique needs work. Let your body recover completely in between tests. Watch a video of the test from the backside so you can see if your feet is working well, and from the side so you can ensure good posture. The video will show the rounded turns and crossing-over steps that cause you to lose speed. Your goal isn’t to go faster at first. It’s move more smartly around the course.
Agility isn’t just speed. Agility is the skill of being able to change direction AND speed and maintain balance. This is a compound skill. It can be broken down into splits, scaled to body mass, adjusted for environment, and measured. What does it say? A lot. It’s your job to read the numbers and fix what’s leaking. Take the weakest split, work on the technique, and test again. The gap will close. You’ll see it not only in total time but in how much more confident you are moving. The clock stops. The learning never stops.