Sweat Loss Percentage Calculator
Estimate sweat loss percentage from pre-workout weight, post-workout weight, fluid intake, urine output, session duration, temperature, humidity, intensity, and athlete profile.
📌Sweat Test Presets
Use nude or dry-clothing body weight before and after exercise. Record fluid consumed and urine passed during the session to estimate total sweat loss more accurately.
⚙Sweat Loss Inputs
Sweat loss snapshot
Enter workout weigh-ins, fluid intake, urine output, duration, and conditions to estimate fluid loss.
📊Hydration Metrics Grid
📑Sweat Loss Reference Tables
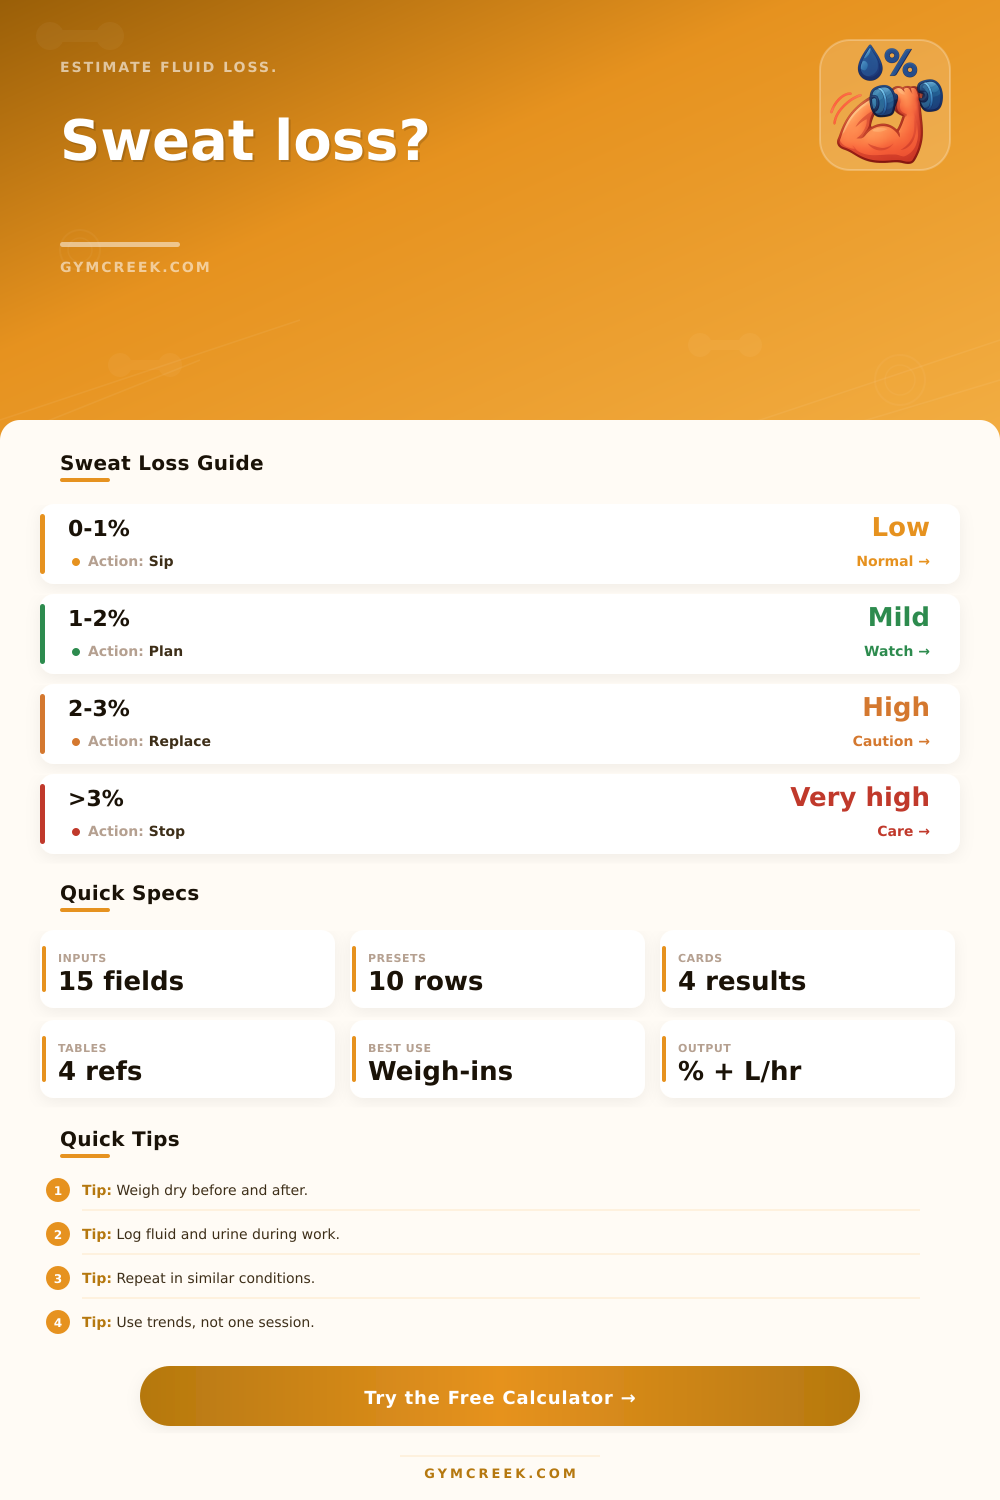
| Loss % | Training Read | Common Cue | Practical Check |
|---|---|---|---|
| 0% to 1% | Low | Usually manageable | Maintain plan |
| 1% to 2% | Mild | Performance may drift | Review drink rate |
| 2% to 3% | High | Heat strain rises | Rehydrate after |
| 3%+ | Very high | Session plan may be too aggressive | Use caution |
| Rate | Liters/hr | Fl oz/hr | Typical Setting |
|---|---|---|---|
| Low | 0.3-0.7 | 10-24 | Cool easy work |
| Moderate | 0.7-1.2 | 24-41 | Steady training |
| High | 1.2-1.8 | 41-61 | Heat or tempo |
| Very high | 1.8+ | 61+ | Heavy heat load |
| Output | Formula | Inputs | Use |
|---|---|---|---|
| Body mass loss % | (pre - post) / pre | weights | Scale loss |
| Total sweat | loss + intake - urine | kg or L | Fluid turnover |
| Sweat rate | sweat / hours | liters, time | Drink planning |
| Rehydrate target | deficit x 1.25-1.5 | net deficit | Recovery plan |
| Sodium loss | L sweat x mg/L | sweat, sodium | Electrolyte context |
| Measure | Value | Per Hour | Training Use |
|---|---|---|---|
| Sweat loss | --- | --- | --- |
💡Sweat Test Tips
You’ve probably hopped off a treadmill or peeled off a sweatshirt post-workout and been surprised by a weight that dropped more then you’d imagined. And you wonder: How much water did I lose? What does this say for my next workout?
Sweat is not just a digit on a display. It’s a logbook of the performance of your body in terms of hydration, exertion and heat exposure. Any athlete will tell you they see different results from identical workouts over time. Sometimes it’s a hot sweaty mess in the shirt; other days that same run are breezy and the towel remains dry.
Why Use a Sweat Rate Calculator
Intensity, clothes, temperature, and humidity changes the equation. The calculator does the math for you when you input workout duration, urine volume, and before/after workout weights along with any water drunk during the session. No more guessing how many liters per hour. No memorizing complex equations mid-panting.
So why bother with all those inputs? Because they each correct for a real factor. The net change is measured by the pre and post workout weights. That change are adjusted to account for fluid consumed and urine passed. The result shows sweat rather than just the difference between intake and weight. Workout length converts the total into a rate so it is comparable from workout to workout.
Ambient temperature and humidity is fed into a heat score that tells you if the conditions were extreme or merely ordinary. Clothing choices and intensity selections tweak the interpretation further because an easy skills workout in a tank top isn’t the same load as a tempo session in full pads.
After plugging in those numbers, there is more than just one percent. You get your sweat rate (how quickly you lost fluids from your body). Then, you see what rehydration target was. How much should of I have replaced after? Next, you get the replacement ratio (did you keep up during that workout or were you behind?). That all can be used to find out if losses were good for training or hurt your performance and/or recovery.
One common pitfall is that one sweat test isn’t definitive. Your bodys ability to sweat changes according to your health/acclimation/fitness/what you ate earlier in the day. If you want to build your range, run the same test under the same conditions another time or two. Another error is chasing 0% loss at all costs. Normal sweat rates includes some loss, pushing too much volume into yourself has its own issues (stomach tolerance/comfort).
Without having to memorize cutoffs, page provides reference tables that categorize your sweat rate so you can take action and turn your loss percentage into a practical signal. Together with the calculator, they transform a weigh-in from yet another data point into a plan.
It gets easier over time. Try this: Weigh yourself dry before and after several key sessions. Note any liquid consumption and any stops for peeing. Let the tool do the conversion. Soon you’ll have a better idea of your bodys response to exertion and heat, and it will make your training decision that much clearer.
It gets more comfortabley as you go. You might recieve different results based off how you feel. Actualy, there is many factors for this. If you want to be more luxurios with your data, use the moddern features.