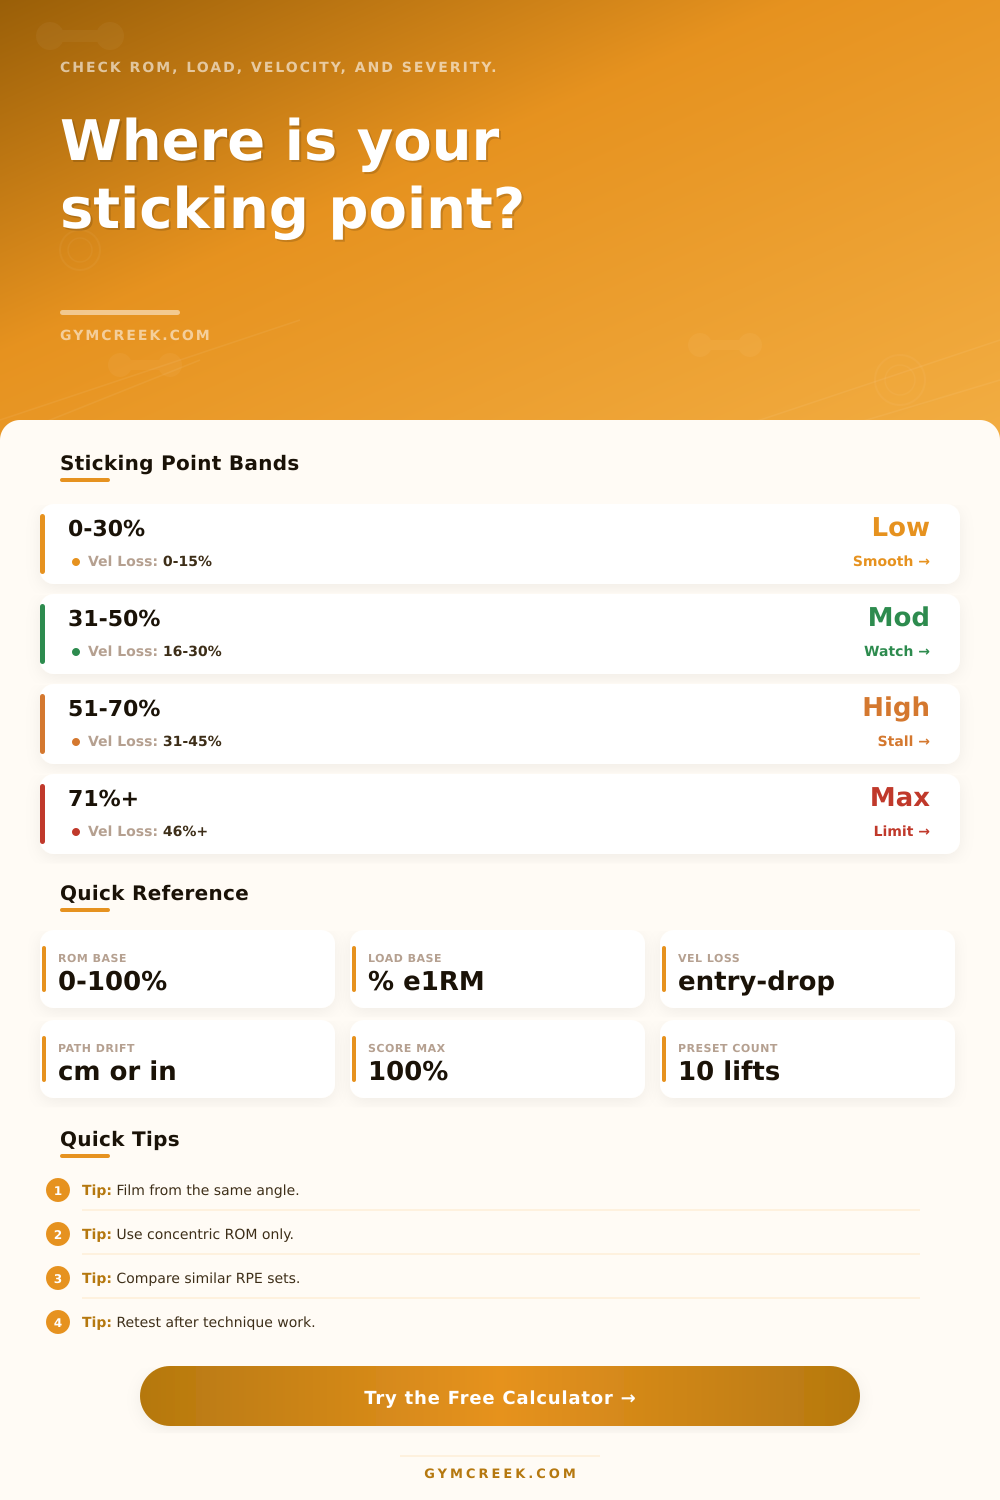
Sticking Point Percentage Calculator
Estimate where a lift stalls in the range of motion, how much load and velocity loss contributed, and what percentage severity the rep shows.
📌Presets
Presets load realistic strength situations and immediately recalculate ROM percentage, load percentage, velocity loss, and sticking severity.
⚙Calculator
Sticking point snapshot
Enter your rep data to calculate the sticking-point percentages.
📊Strength Metrics Grid
📑Reference Tables
| Lift | Common Zone | ROM Meaning | Main Signal |
|---|---|---|---|
| Bench press | 35-65% | Chest to mid-range | Pec to triceps transfer |
| Back squat | 20-55% | Out of the hole | Position and quad drive |
| Deadlift | 5-45% | Floor to knee | Break strength and wedge |
| Overhead press | 45-75% | Face to forehead | Bar path and lockout |
| Weighted pull-up | 65-90% | Top third | Elbow drive and finish |
| Severity | Band | Rep Look | Load Choice |
|---|---|---|---|
| 0-24% | Smooth | No clear stall | Keep normal jumps |
| 25-44% | Manage | Minor slowdown | Small technique cue |
| 45-64% | Sticky | Visible grind | Trim 2-5% load |
| 65-84% | Limit | Long grind | Trim 5-8% load |
| 85-100% | Miss risk | Near failure | Reduce or stop |
| Velocity Loss | Strength Read | Fatigue Read | Use |
|---|---|---|---|
| 0-15% | Fast reserve | Low | Power sets |
| 16-30% | Normal heavy | Moderate | Working sets |
| 31-45% | True grind | High | Top sets |
| 46-60% | Limit rep | Very high | Stop soon |
| 61%+ | Failure risk | Max | End attempt |
| Formula | Variables | Output | Why It Matters |
|---|---|---|---|
| ROM midpoint | Start, end | Stall % | Locates the weak range |
| Epley e1RM | Load, reps | Max check | Normalizes load |
| Velocity loss | Entry, slowest | Drop % | Finds speed decay |
| Severity blend | ROM, load, speed | Score % | Ranks the sticking point |
💡Tips
This is what it feels like: The bar isn’t moving. It doesn’t matter how hard you try. Your legs is shaking and you’re straining, but then there’s this point. It is this spot where weight won’t go any farther.
Most people think they lack motivation. Or maybe it was just bad luck. That’s hardly ever true. There comes an exact point during your range of motion when fatigue meets physics. Knowing where that collision occurs alter your training. It transforms a general feeling of being weak into something tangible and correctable.
How to Fix Your Weak Point in Lifts
When you enter your rep numbers into the sticking point percentage calculator it will crunch the numbers for you and let you know what percentage of the exercise stick. You will no longer have to guess whether you failed because of bad form or because weight was too heavy. Now you’re not even looking at number anymore when you miss a lift, you’re looking at percentages.
So what’s the first thing you put into the calculator? It is middle of the range of motion. Is this a squat where you fail right out of hole or a bench press where you stall short of lockout? These are two totally different things that needs two completely different solutions. If you fail at bottom of a squat, does it mean you need more quad strength or better hip hinge mechanics? If you stall at the top, that’s probably an elbow flare or tricep issue. By using the tool in that zone, you’ll stop working the wrong muscle group.
There’s an element of load intensity involved, but velocity loss is the real deal. Sometimes you’re using a “heavy” weight based off the piece of paper, but you’ve got decent bar speed up until the last few inches. That indicates that it’s not raw strength limiting performance; instead it’s some technical breakdown. Conversely, if you see a sharp speed drop early in the rep, then you’re probably overloaded for today’s work capacity.
It also groups severity into bands (check the reference table on page). Smooth = keep pushing. Limit = back off now and avoid collapsing form/injury.
People overlook bar path deviance as being just a little bit. They ask, “What’s a couple of inches? It’s nothing more then missing my lift!” Not so fast. If your bar is moving from side-to-side on a deadlift or sliding forward on a bench press, you’re battling leverage problems long before you hit the sticking point and they sap your energy. Frequently, fixing the path corrects the stall and doesn’t require one extra pound added to your max effort. The severity score accounts for this shift in bar path. Remember, we measure both brute force and efficiency.
If you’re not sure how to begin, presets can be helpful for benchmarking purposes. Choosing a squat hole preset will populate common values for that lift pattern so that you have something to base it off as you compare your results. Maybe you find out you lose speed far more than average model predicts. The difference there (what’s expected versus what happens) is where the improvement lies. That reveals to you this isn’t a “strength problem,” but a “fatigue management” or “speed endurance” problem.
The only way to know if a technique worked is to retest. So if you paused squatting for three weeks to remedy your whole stall, run the numbers again. Did your velocity loss normalize? Did your severity score decrease? If not, adjust your training plan accordingly. The data takes emotion out of it. You could of guessed yourself into being stronger because the bar doesn’t say so.
Constraints are the name of the game when it comes to training. There’s only so much time available, a finite amount of recovery, and a set of biomechanical limitations. When you know exactly what your sticking point is, you can direct your resources to match. Don’t waste time performing exercises that won’t even touch your true weak link. Measure it for real, identify the sticking point, and attack it head-on.
When you stop chasing ghosts and begin solving an equation, bar moves.