Stationary Bike Resistance Calculator
Translate indoor bike resistance into estimated watts, torque, FTP zone, equivalent scale levels, and calorie context using cadence, bike type, rider profile, and session length.
📌Presets
Presets load real indoor cycling situations, from easy recumbent work to heavy climb intervals, then recalculate equivalent levels automatically.
⚙Calculator
Resistance snapshot
Enter your bike setup to estimate resistance meaning.
📊Resistance Metrics
📑Reference Tables
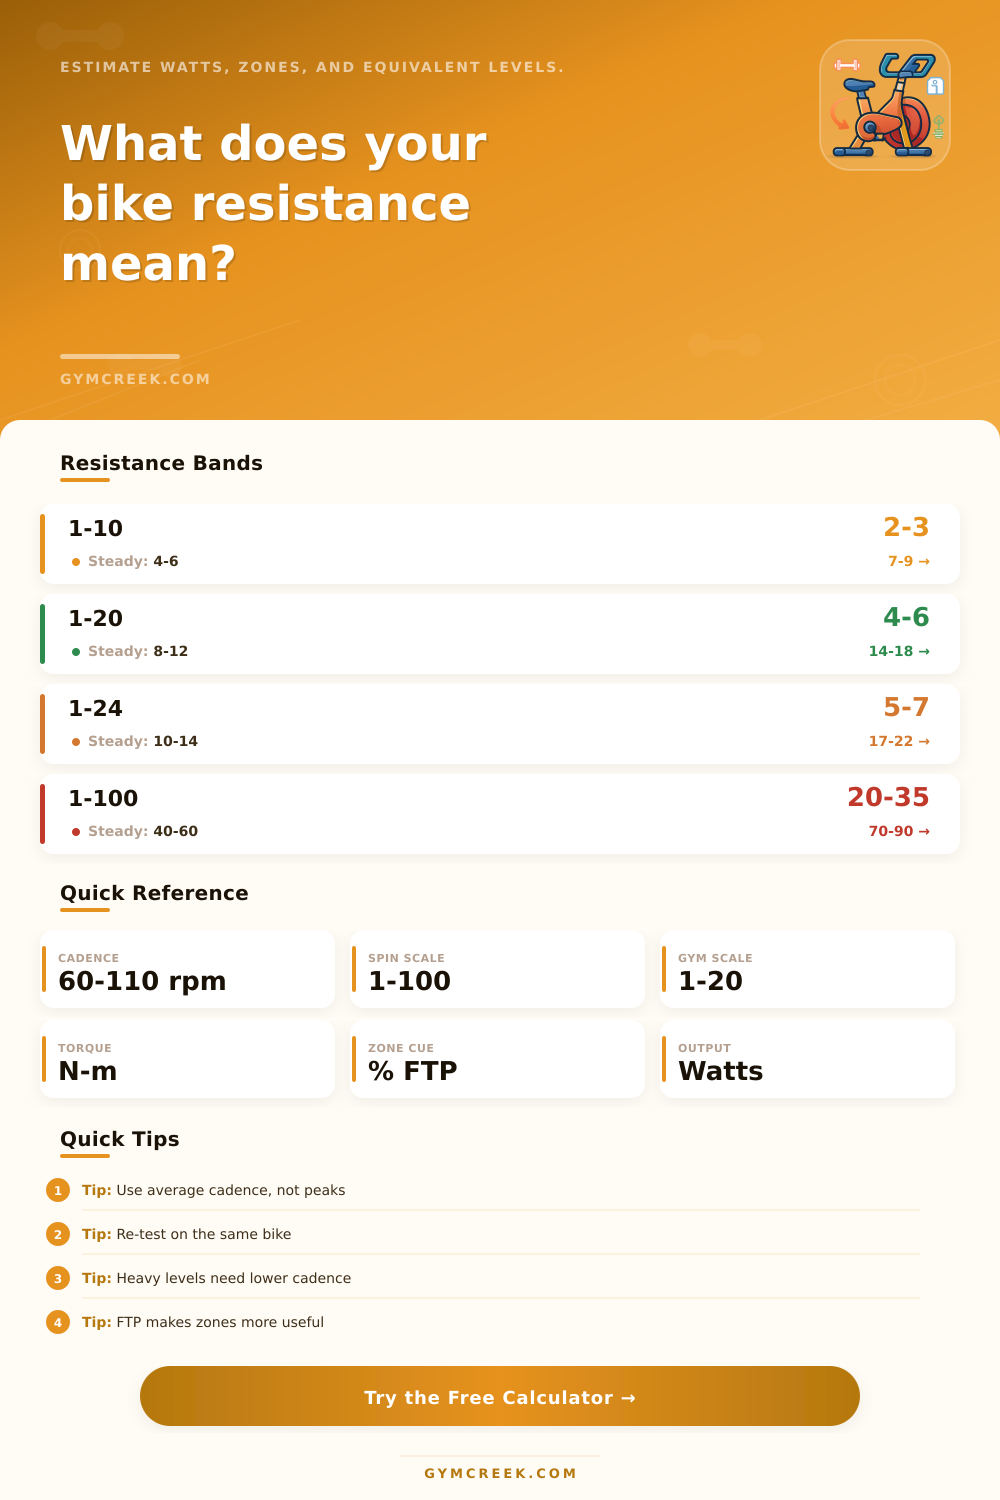
| Feel | 1-10 | 1-20 | 1-100 |
|---|---|---|---|
| Very easy | 1-2 | 2-4 | 10-20 |
| Endurance | 3-5 | 6-10 | 30-50 |
| Tempo | 5-7 | 10-14 | 50-70 |
| Climb | 7-9 | 14-18 | 70-90 |
| Cadence | Best resistance | Likely feel | Use |
|---|---|---|---|
| 55-69 rpm | Heavy | Torque | Climbs |
| 70-84 rpm | Moderate-heavy | Controlled | Tempo |
| 85-99 rpm | Moderate | Balanced | Endurance |
| 100-115 rpm | Light-moderate | Quick | Spin-ups |
| Zone | % FTP | Resistance cue | Session use |
|---|---|---|---|
| Recovery | <55% | Light | Warm-up |
| Zone 2 | 56-75% | Steady | Base |
| Tempo | 76-90% | Firm | Builds |
| Threshold | 91-105% | Hard | Intervals |
| VO2 | 106%+ | Very hard | Surges |
| Formula | Inputs | Output | Why it helps |
|---|---|---|---|
| Resistance map | Level and scale | Percent | Compare bikes |
| Power model | Percent and rpm | Watts | Work estimate |
| Torque | Watts and rpm | N-m | Load feel |
| Mifflin | Age and size | BMR | Daily context |
💡Tips
Bike manufacturers uses a variety of resistance scales. For example, one manufacturer may use a scale of 1 to 10, but another manufacturer may use a scale from 1 to 100. Due to the fact that resistance levels is expressed on such scales, it is difficult for a person to directly compare the workouts they performs on two bikes.
For example, a resistance level of 9 may be expressed on one bike, while another bike may read 48 for the same level of resistance. Thus, resistance is one of the factors that determine the amount of work that is performed on the stationary bike; cadence is another factor that contribute to the total amount of work that is performed. High cadence with low resistance levels will result in the same amount of work as low cadence with high resistance levels.
How the Bike Resistance Calculator Works
The calculator require the user to input several factors related to the user and there stationary bike. The calculator requires that each user input their cadence, their resistance level, the type of bike that they use, and their personal profile. Based on these inputs, the calculator can determine each user’s estimated watts, the estimated torque for the stationary bike, and it can also determine the resistance level for other common resistance scales.
This calculator is beneficial for each stationary bike user because it can help to normalize the feeling of the resistance scales from different makes of bikes. For instance, a resistance level of 12 on one type of bike may have the same resistance percentage as a resistance level of 7 on a different type of bike manufacturer. Each of these factors will help the user to understand how much effort they are putting into each ride, and to maintain that same level of effort on each bike.
Cadence is a factor that can contribute to the amount of watts and torque that are create by a stationary bike. For example, when a user increases their cadence, the amount of watts and torque that their bike will create will change. Additionally, because the relationship between cadence and torque is not linear, the calculator must take into account the relationship between these two factor.
For instance, a cadence of 90 rpm may have a different relationship with resistance compared to a cadence of 60 rpm. The calculator ensures that efforts at 90 rpm will not be treated the same as efforts at 60 rpm. Additionally, the effort input will allow the calculator’s model to reflect the different types of efforts that the user may perform during their workout.
Factors like body weight and activity level are also used to calculate the parameters for the stationary bike workout. For instance, body weight and activity level allows the calculator to estimate an FTP for users that have not previously performed an FTP test. Additionally, body weight and activity level will help to provide an estimate of the calories that the user will burn during this workout.
While a 150-pound user and a 200-pound user may have the same watts while cycling at the same resistance level and cadence, the 150-pound user will be performing at a higher percentage of their total cycling capacity. Thus, the bike calculator can provide a watts per kilogram reading and a zone estimate to reflect this difference. The reference tables are included on the calculator’s webpage in order to allow the users to quickly find information without having to input each value for their workout.
The tables include information about the resistance levels on different scales, such as scales of 1-10, 1-20, and 1-100. Additionally, the tables also include information about the cadence levels and resistance levels that create a certain feeling for the bike riders. These tables are only starting points for stationary bike riders; the bikes that each user owns may have different resistance levels than those expressed in the tables.
Thus, each user will gain an understanding of their bike’s resistance levels over time, and be able to adjust the bikes settings according to those level. Bikes may have varying levels of resistance levels over time. For instance, the resistance levels may change if the bikes becomes dirty.
Dirty belts or dirty magnets will change the resistance that is created by the bike. Thus, the calculator encourages users to re-test each of their workouts from each bike every few weeks. The bike calculator allows the users to easily compare these workouts to each other.
The results of each workout may differ based off the user’s posture while riding the bike. For instance, if a user stands on the pedals, they will be increasing the load on the bike. Additionally, if the user is using an aerodynamic position on a trainer, they may have a disadvantage relative to the other stationary bikes.
To account for these difference, the calculator includes a multiplier for both standing on the pedals and for aerodynamic positioning on trainers. The main benefit of calculating each of these factors for stationary bikes is that the users can make decision regarding their training based upon the results. For instance, if a user calculates their effort for one type of endurance ride, they may find that the effort percentage is 68% of their FTP.
In this instance, they may adjust the resistance levels of their bike to 60% of their FTP. Likewise, if the user finds that their tempo ride percentages are only at 78% of their FTP, they may adjust the resistance levels to ensure that they hit their target percentage for that type of ride. Other factors that impact the calculation of each user’s workout are session length and target mode.
For instance, a 20-minute session will have a different amount of total work performed than a 45-minute session at the same resistance levels. The calculator allows for users to test what resistance levels are required to reach a target zone for a certain duration. Finally, the estimated heart rate is another factor that may help each user to monitor their workout.
While the estimated heart rate isnt a medical prescription for the users’ workouts, it may help users to ensure that the effort level matches the perceived effort for the workout. Any significant difference between the estimated heart rate and the calculated wattage may be indicative of either an inaccurate FTP level or incorrect bike resistance settings.