Stationary Bike Cadence Calculator
Calculate actual RPM from crank revolutions and interval time, then compare target cadence, flywheel feel, gear ratio, resistance, RPE, and workout type.
📌Presets
Each preset loads bike setup, crank-count timing, target RPM, resistance, RPE, workout type, and rider context for a cadence-focused output.
⚙Calculator
Cadence snapshot
Enter crank revolutions, interval time, target RPM, resistance, flywheel setup, and RPE to classify cadence.
📊Cadence Outputs
📘Reference Tables
| Zone | RPM range | Best fit | Watch for |
|---|---|---|---|
| Recovery spin | 50-64 RPM | Cooldowns, easy flushes, warmups | Too much resistance can become grinding |
| Endurance base | 65-84 RPM | Longer aerobic intervals and controlled rides | RPE climbing while RPM stays unchanged |
| Tempo work | 85-99 RPM | Most steady indoor work and cadence practice | Bouncing, sloppy pedal stroke, or rushed breathing |
| High-cadence drill | 100-114 RPM | Neuromuscular spin-ups and leg-speed sets | Resistance too low to control the flywheel |
| Short sprint | 115+ RPM | Very short bursts with smooth form | Form breakdown or excessive saddle bounce |
| Workout type | Target RPM | Resistance feel | RPE guide |
|---|---|---|---|
| Recovery spin | 55-75 | Light and smooth | 1-3 |
| Endurance base | 70-90 | Light to moderate | 3-5 |
| Tempo / steady work | 80-100 | Moderate and controlled | 5-7 |
| Heavy seated climb | 55-75 | Heavy but smooth | 6-8 |
| High-cadence drill | 100-120 | Light enough to stay relaxed | 4-7 |
| HIIT interval | 90-120 | Hard but repeatable | 7-9 |
| Threshold set | 85-100 | Firm and repeatable | 7-8.5 |
| Standing climb | 50-70 | Heavy and stable | 6-9 |
| Setup signal | Calculator input | Cadence effect | Adjustment cue |
|---|---|---|---|
| Heavy flywheel | 35 lb or 16 kg and above | More momentum, smoother but harder to change quickly | Use slightly earlier cadence changes |
| Light flywheel | Under 25 lb or 11 kg | Less stored momentum and quicker RPM response | Control surges with smooth pressure |
| High gear ratio | 3.0 flywheel turns or more | Flywheel spins many times per crank turn | Avoid chasing RPM with jerky strokes |
| High resistance | 60+ on a 1-100 scale | Cadence may fall if torque demand is too high | Reduce load if target gap widens |
| Low resistance | Under 25 on a 1-100 scale | Fast cadence can feel uncontrolled | Add load if bouncing appears |
| Metric | Formula | Input source | Use |
|---|---|---|---|
| Actual cadence | Crank turns / seconds x 60 | Counted revolutions and interval duration | Primary RPM result |
| Target turns | Target RPM x seconds / 60 | Target cadence and interval duration | Count goal for the next interval |
| Flywheel RPM | Actual RPM x drive ratio | Cadence and gear ratio | Momentum feel estimate |
| Load score | Cadence x resistance x flywheel factors | RPM, resistance, flywheel, gear, RPE | Compare similar indoor sessions |
| Target match | 100 minus RPM error penalty | Actual RPM and target RPM | Cadence control rating |
💡Tips
Cadence refer to the speed at which a person turns the pedal on a stationary bike. Cadence is an important measurement of stationary bike workouts because cadence determine whether the stationary bike workout will increase an individual’s endurance or increase there speed. While many individual focus upon the number displayed on the stationary bike console, that number may not accurately reflect the speed at which an individual’s legs is moving.
To determine the actual cadence that an individual is exercising at, that individual can count the number of revolutions of the pedals over a specific amount of time. By counting the number of revolutions over a specific amount of time, an individual can compare their actual cadence to their target cadence to determine whether their dropped cadence was the result of increased resistance or fatigue. The calculator located on this website will assist an individual in determining the difference between their actual cadence and their target cadence.
How to Measure Cadence on a Stationary Bike
Each individual will have to input the number of counted turn of the pedals, the number of seconds in which they counted the turns, and the target cadence that they desired to achieve. Based off these inputs, the calculator will display for the individual the gap between their actual and target cadence, as well as a match score that indicate the difference between the two cadences without the individual having to perform the calculations themselves. In addition to the factors that relate to the individual’s performance of the stationary bike routine, factors related to the stationary bike itself can also impact an individual’s cadence.
The weight of the stationary bikes flywheel impact the cadence that an individual feels; bikes with a heavy flywheel will make changes to an individual’s cadence take longer to appear on the display compared to bikes with light flyweights. Additionally, the gear ratio impact an individual’s cadence; the gear ratio is the number of times the stationary bikes flywheel will rotate compared to the number of times an individual turns the pedals once. Both of these factor will be represented in a score on the calculator to provide an individual with an understanding of how their stationary bike may be impacting their cadence.
Besides the factors related to the individual and the stationary bike itself, there are difference in measurements between resistance and effort. While each stationary bike has a resistance setting that can be adjusted, the effort that an individual must put into cycling at that resistance can change. For instance, an individual may feel like they can achieve a certain resistance level when they are more fatigued than when they are more rested.
The Rate of Perceived Exertion (RPE) will allow for this difference between resistance and effort to become visible; both measure together will allow an individual to determine whether or not the stationary bikes resistance level is appropriate to that individual’s workout that week. Finally, the body position of an individual on the stationary bike may also impact their cadence; standing on the pedals activates different muscle groups than when an individual is sitting on the pedals. Additionally, body weight pressing on the pedals will change between standing and sitting position.
As a result of these difference, the same resistance may feel moderate when an individual is sitting, but feel heavy when that same individual is standing on the pedals. The calculator also asks for an individual to indicate whether they were riding in seated positions only, standing positions only, or a combination of each position. Within any stationary bike workout, there are specific cadence zone for different types of workouts.
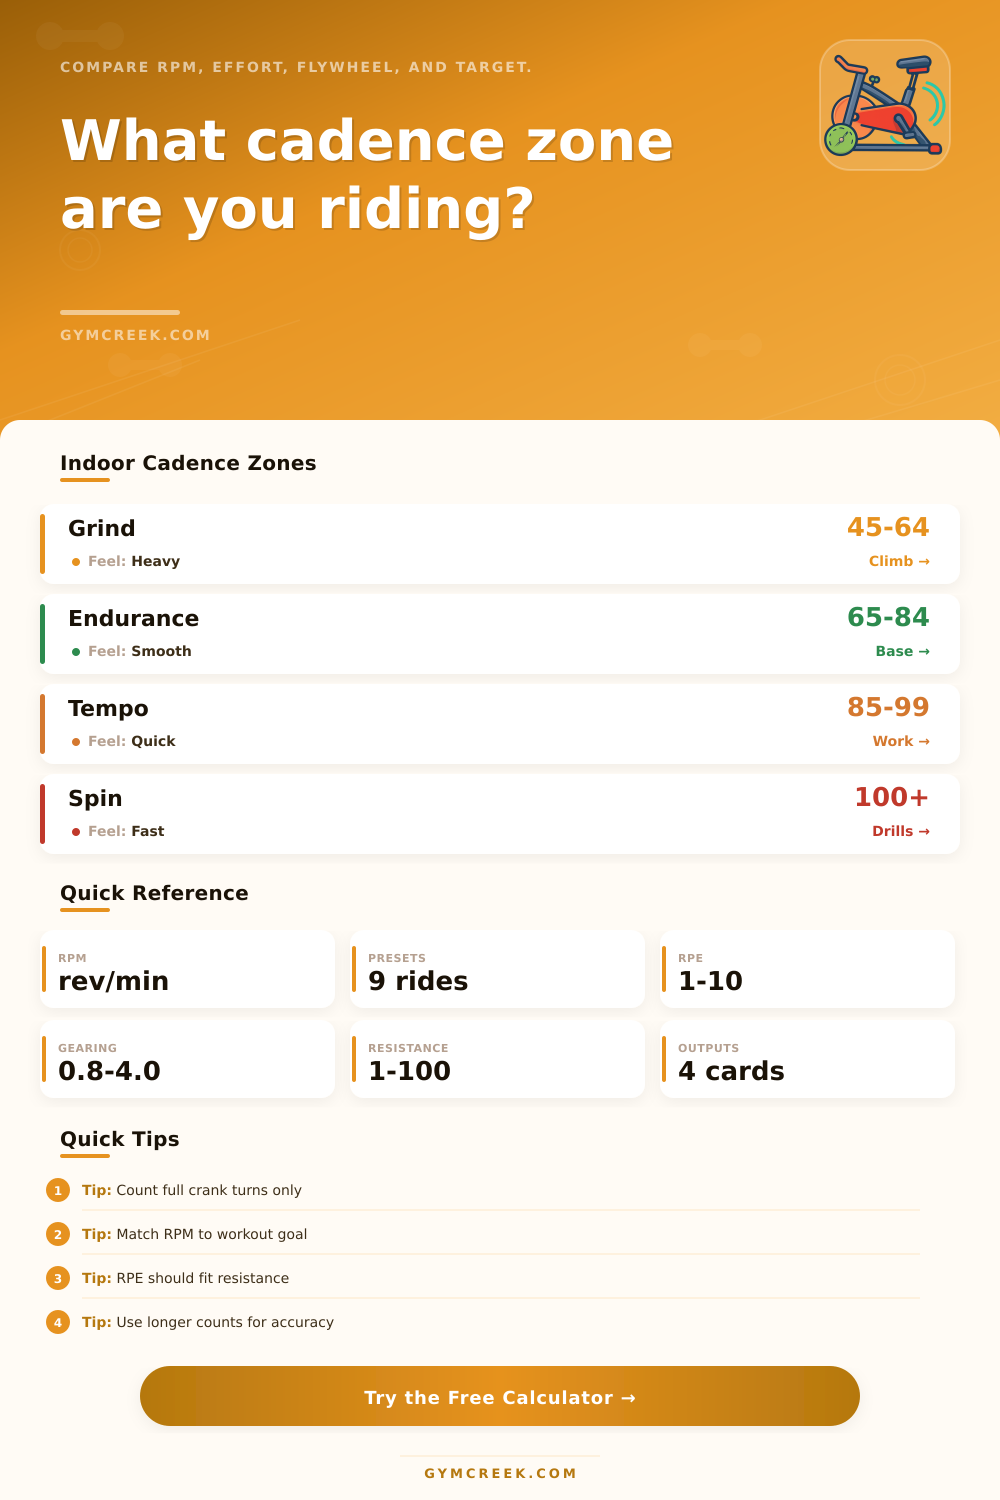
For instance, recovery spins will have cadence zones within the low 50s to the mid 60s to facilitate blood flow. Endurance workouts will be performed within the 70s to maintain an individual’s heart rate. Tempo intervals will have a higher cadence than endurance workouts because they are suppose to be more challenging for an individual.
Finally, short drills for increasing a riders leg speed will use the highest cadence zones of any stationary bike workouts. These cadence zones can be found within the reference table on the calculator. Common mistake can be made when attempting to calculate cadence.
For instance, some individuals may count the number of revolutions of the pedals for only ten second. However, because of the shorter time frame, an individual may introduce an error into their calculation of cadence. Some individuals may also ignore fatigue level throughout the ride and use a resistance level for setting their resistance level on the stationary bike.
Additionally, some individuals may attempt to increase their cadence by lowering the resistance until the flywheel feels as if it is disconnected from their legs, but using too low of a resistance level will cause their power measurement on the stationary bike to drop. These different factors will be represented on the calculator to allow an individual to make these trade-offs within their mind and to provide an indication of whether or not they believe that their training is appropriate with their goal. Cadence can have value over a period of multiple training sessions.
For instance, after forty minutes of cycling an individual’s cadence may droop to a lower rate; this can be caused by fatigue. Additionally, individuals can learn that high-cadence drills require certain resistance levels for the best result; the resistance level may change based upon the weight of the flywheel. Finally, individuals can learn that stands and climbs require different resistance level than seated climbs on stationary bikes.
These factor can be learned over time by individuals by measuring their cadence during each bike ride; measuring cadence allow individuals to have insight into the performance of each stationary bike that they own. Beyond simply calculating each individuals performance on the stationary bike, the calculator help to provide individual with a measurement of their performance without the use of a notebook. Furthermore, the stationary bike calculator can transform the simple counting of the revolutions of the pedals into numbers that indicate an individual’s effort, control of the bike, and their equipment.
These number can become a means for individuals to plan their next stationary bike ride. Thus, utilizing each of these number indicates that an individual’s stationary bike has the potential to become a training tool that they can steer and control.