Squat Jump Height Calculator
Estimate squat jump height, takeoff velocity, flight time, peak power, relative power, and trial quality from force plate, jump mat, app, or measured height data.
📌Presets
Each preset fills a realistic athlete profile, testing method, squat depth, hold time, body size, measured output, and trial set.
⚙Calculator
Squat jump snapshot
Enter a flight time, measured height, or takeoff velocity to calculate jump height and related power metrics.
🧮Formula Cards
📊Squat Jump Metrics Grid
📑Reference Tables
| Training Group | Developing | Competitive | High Output |
|---|---|---|---|
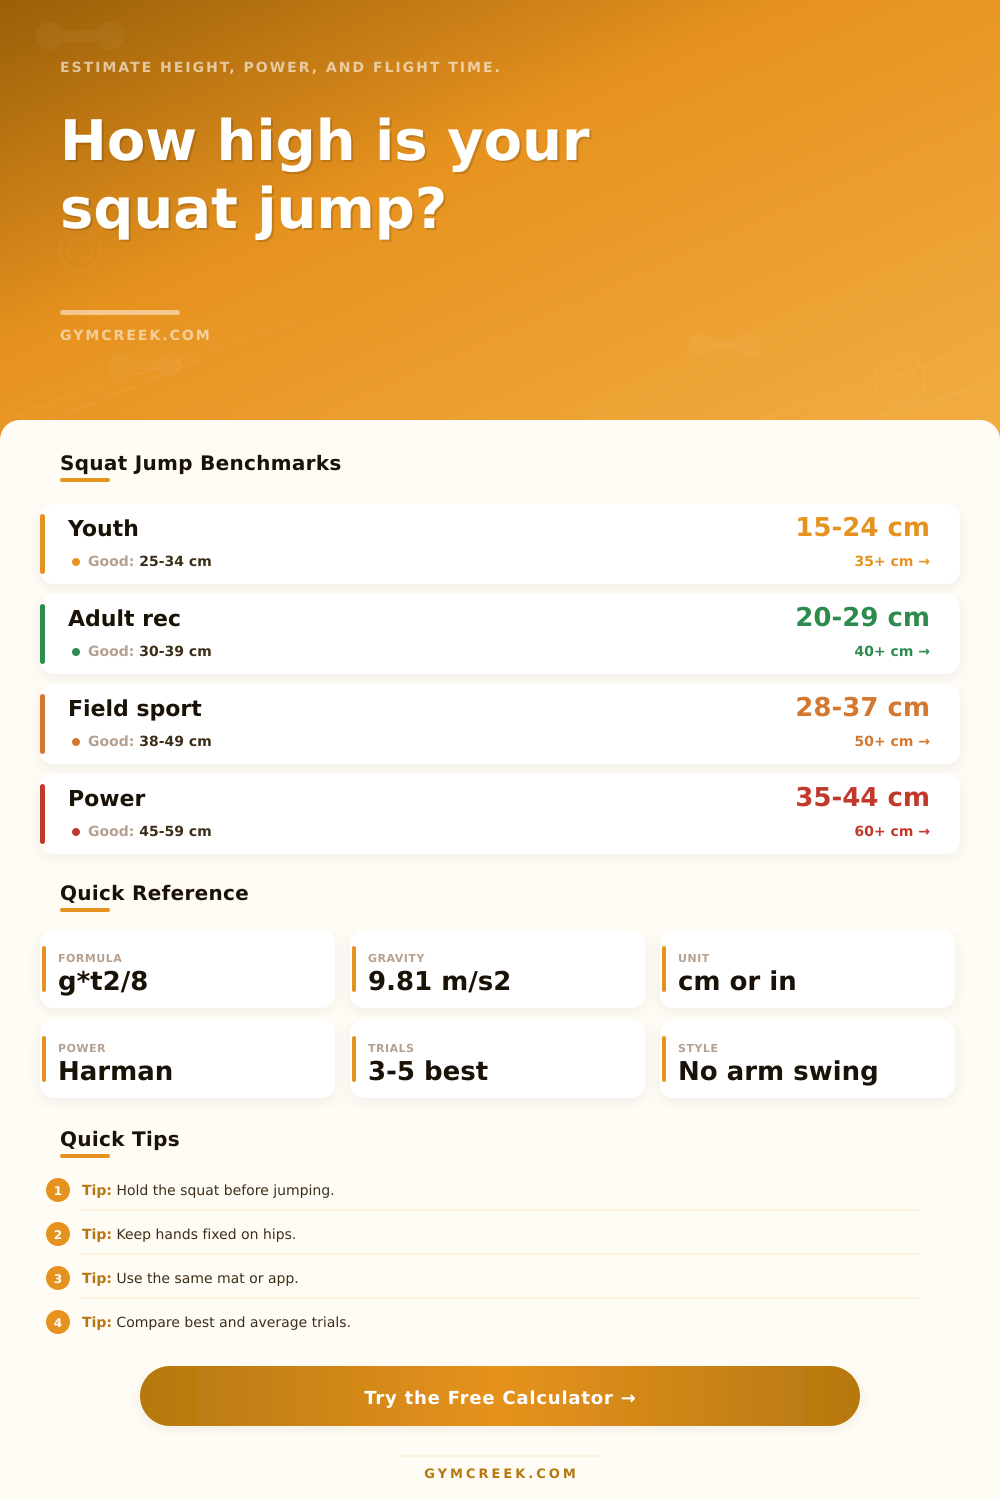
| Youth athlete | 15–24 cm | 25–34 cm | 35+ cm |
| Adult recreational | 20–29 cm | 30–39 cm | 40+ cm |
| Court or field sport | 28–37 cm | 38–49 cm | 50+ cm |
| Power or jump sport | 35–44 cm | 45–59 cm | 60+ cm |
| Method | Primary Input | Best Use | Watch Point |
|---|---|---|---|
| Flight time mat | Milliseconds | Fast team testing | Landing posture affects time |
| Force plate | Velocity or height | Power profiling | Use same filtering settings |
| Video app | Flight time | Field checks | Frame rate limits precision |
| Reach device | Displacement | Simple height tracking | Arm use can inflate score |
| Scenario | Typical Height | Power Cue | Retest Note |
|---|---|---|---|
| Strict hands-on-hips squat jump | Lower than CMJ | Concentric output | Hold depth constant |
| Free-arm jump recorded as squat jump | Inflated | Mixed contribution | Mark separately |
| Return-to-play comparison | Side context | Monitor trend | Use same device |
| Power block tracking | Rising trend | W/kg improves | Compare best and average |
| Formula | Variables | Output | Use |
|---|---|---|---|
| h = g x t² / 8 | g, flight time | Jump height | Mat or video |
| v = sqrt(2gh) | g, height | Takeoff velocity | Force estimate |
| Flight = 2v / g | velocity, g | Air time | Velocity input |
| Harman power | height, mass | Peak watts | Power estimate |
💡Tips
The squat jump provide a pure test of raw power (with no assistance from momentum). From a starting position, you’re stationary on the ground. Next, you drive explosively upwards. Without stretch reflex common to athletes, it’s a straight-forward check of concentric strength.
That’s why the calculator does all the math for you. However, it’s important to know how the numbers translate. The tool converts flight time, takeoff velocity, or direct height measurements into an easily interpretable indicator of power. The calculator use physics to draw a connection between floor force and air time.
What the Results Mean
Why? Because jump height alone isn’t sufficient. A smaller athlete could jump less high then his larger teammate. Yet, he might generate greater power in proportion to his body size. Using the Harman equation, the calculator fix that issue. This formula considers both bodyweight and jump height. A big body require more force to move it. Without this adjustment, we cannot compare one athlete to another.
The comparison table categorize athletes according to their level and sport. By using these reference values, you’ll be able to see whether or not your measurements falls within normal limits. But keep in mind: benchmarks should of used as starting points only. Just because an athlete jumps higher doesn’t mean they are more powerful relative to their body mass.
Big swings in performance from jump to jump indicate technical flaw. It could also mean that they didn’t properly warm up. The calculator calculates the difference between your best and worst trials. A tight range indicates consistency, which is critical to measuring improvement over time. You won’t know you’ve improved if you has wide swings in performance. Reducing “noise” is what standardization does for the test.
Your arms don’t swing when you hold them at your sides. Your arms add momentum. That isn’t generated by your legs. What’s a clean measure of lower-body power? Get rid of it. A two-second hold removes arm-assisted momentum and allow elastic energy to dissipate. Now you’re forced to use muscle force alone. That transforms a bounce into a push.
Everyone tries to hit a target height. Their goal is to max out that number. But takeoff velocity is a better predictor over the long run. If you has high velocity, you can create force fast. That transfers to running fast (and changing directions). The tool calculates that velocity for you. It uses kinematic equations to find it from your jump height.
No force plate needed. Flight time from a video app or jump mat will do. It’s all about doing it the same way each time. You’ll run into issues if you try switching up devices, each has a little difference. Stick with one and you’re tracking true change. Eliminate equipment differences.
Decimal places make it easy to lose focus. The trend is what counts. Did power estimates increase week after week? Does your consistency improve? These are the questions that drive your training adaptations.
That single high jump could be pure luck. Several high jumps, with low variation, represent mastery. The tool eliminates guesswork. Let physics do the math. Focus on the execution. Your job is to execute. Squat. Drive. Land softly. Then review the numbers. The data reflects what your legs feel. Power isn’t measured only in height. It’s measured in repeatability.