Sprinting Calculator
Estimate sprint splits, average speed, top speed, acceleration, force, and power from a race time, body size, start setup, wind, and surface.
📌Presets
Each preset loads a realistic sprint profile, including start style, split marker, wind, surface, and body size.
⚙Calculator
Sprint performance snapshot
Enter a sprint time and calculate speed, acceleration, power, and split projections.
📊Sprint Metrics Grid
📑Reference Tables
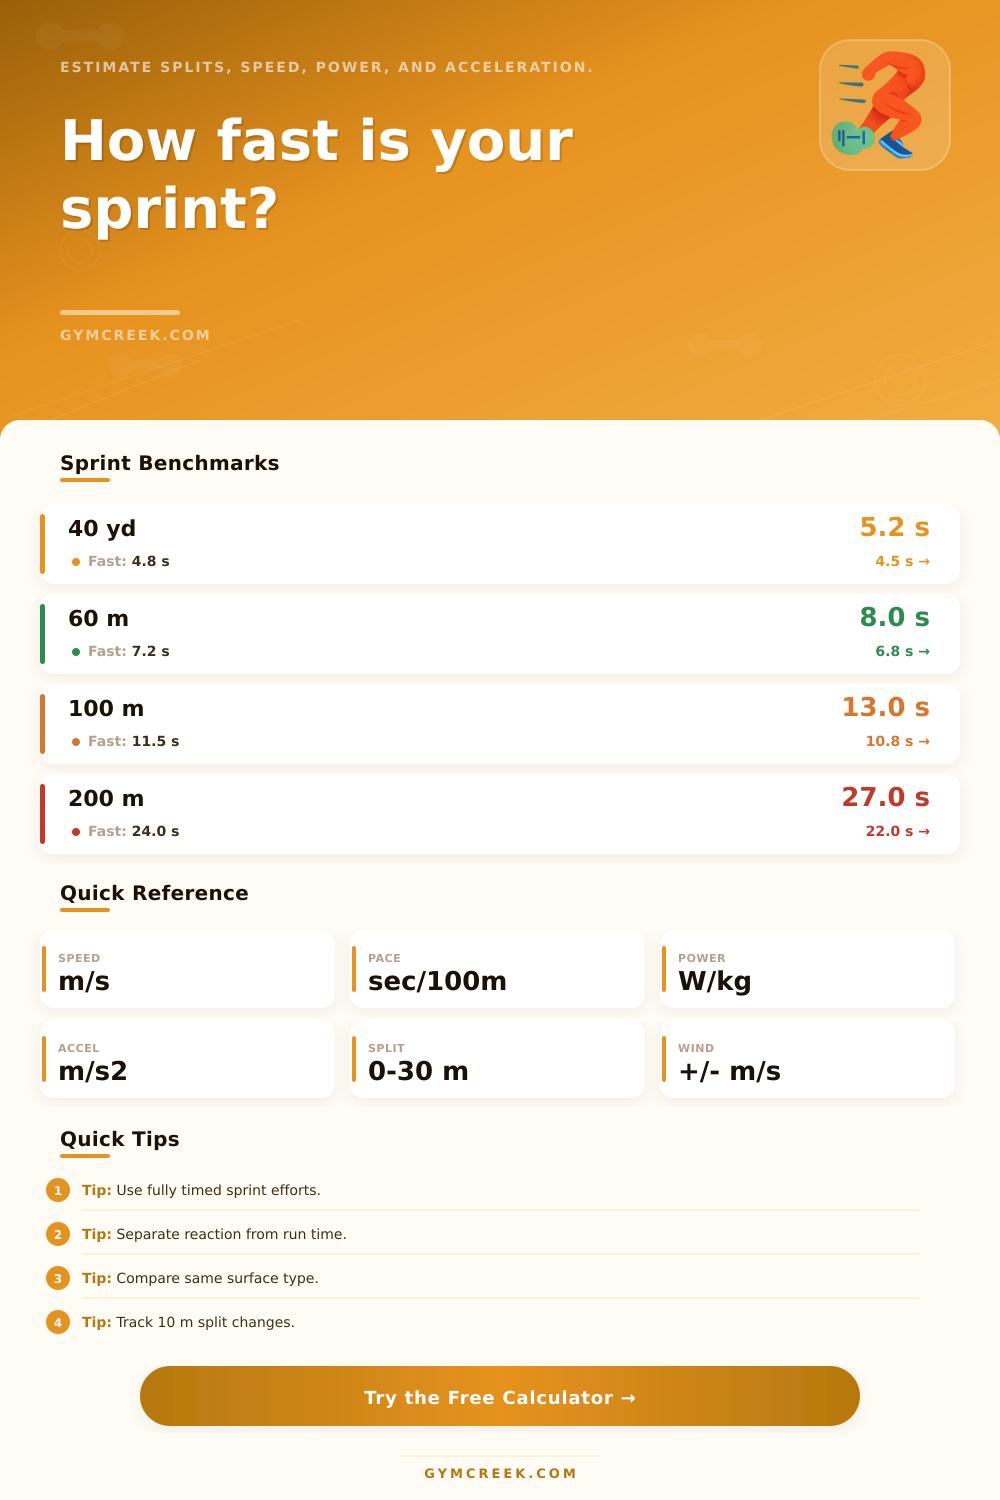
| Event | Good | Fast | Elite |
|---|---|---|---|
| 40 yd | 5.2 sec | 4.8 sec | 4.5 sec |
| 60 m | 8.0 sec | 7.2 sec | 6.8 sec |
| 100 m | 13.0 sec | 11.5 sec | 10.8 sec |
| 200 m | 27.0 sec | 24.0 sec | 22.0 sec |
| Metric | Formula | Input | Use |
|---|---|---|---|
| Average speed | Distance / time | Run time | Race pace |
| Acceleration | Speed / split | Split time | Start quality |
| Power index | KE / accel time | Mass, speed | Compare sessions |
| Stride estimate | Speed / cadence | Speed, height | Rhythm check |
| Surface | Adjustment | Best Use | Note |
|---|---|---|---|
| Track | 0% | Race testing | Fastest baseline |
| Turf | -2% | Field sport | Traction varies |
| Grass | -4% | Outdoor tempo | Check footing |
| Sand | -12% | Resisted work | Not race-like |
| Segment | What It Shows | Typical Marker | Watch |
|---|---|---|---|
| 0-10 m | Drive | First step | Push angle |
| 0-30 m | Acceleration | Speed build | Posture rise |
| 30-60 m | Max velocity | Upright sprint | Relaxation |
| 80-200 m | Speed endurance | Hold speed | Deceleration |
💡Tips
You discover that your stopwatch wasn’t on during athlete’s movement, and now you’re panicking. Did they go four point three? Was it a reaction time delay or actual movement speed? Or did they actualy move slower? Because a millisecond can be everything in sprinting. A hundredth of a second can mean the difference between good and elite performance.
So it’s important to get clean data. And that’s where this calculator comes in. Here’s how it works. You input your raw times and out come results… Power output estimates, acceleration phases and more. It also takes care of conversions for body mass and distance. No need to mess around with physics equations in practice.
Understanding Your Sprint Data
But knowing what these numbers mean is equally important. The last number on the screen (the time), are treated by most as the only scorecard. Wrong. The 100 meter dash isn’t one event at all but rather three distinct physiological phases rolled up into one progression.
Stage one is the get off the mark stage, getting up to speed from standing still to thirty meters. This is about forward force and the angle of your push off the ground. Here it’s all about reaction time at the start and how you begin. It recognize that this is where traction counts, as it depends on your start method and the surface. An explosive start is made easier by a solid starting position like a block start on a synthetic track. Turf or grass might shift underfoot stealing energy that should of go into velocity. Variables in the environment affect its predictions of performance.
Phase two is from 30-60 meters, where we transition to max speed. Stride length go up, as does posture. Here’s what determines your speed: How many meters do you cover with every step while maintaining momentum? If you’re tall, the answer will be higher. In general, taller athletes have longer limbs that they can control to extend their strides more. This is why your height factor into the equation. Power output is calculated by multiplying speed and body mass. This gives us an idea of our mechanical efficiency and whether or not we’re using any technique or simply force.
Speed endurance (ability to maintain maximum velocity while fatigued) is the last phase. This is where the race is often lost, not at the start but near the finish line. Near the end of a race form starts breaking down and lactic acid accumulates in the muscles. Half a second slower over the last 20 meters has been known to drop you off the podium.
By breaking the distances into segments, the table below provides some performance benchmarks. Compare your split times with the table to see if you are starting too slowly or having trouble keeping your speed.
Sprint Analysis also depends heavily on context. Wind matters. If I’m running with a two meter-per-second tailwind, it will shave time off my result without any improvement in my physical performance. If I’m running against a headwind, it will slow me down because the wind creates drag. You can input the wind reading to adjust for wind and the track grade to know whether the time you ran was on a flat track or on a hill. That means a time run on the hill isn’t being compared to a flat track performance.
It takes out environmental distractions so you can understand what’s going on under the hood, the athlete itself. But data doesn’t matter unless you do something with it. If I see my acceleration stinks, I’ll do some drills to improve angle management and hip drive. If I notice I’m not going any faster, I know I should be doing some stride frequency or plyometric power drills. Training cures the problem; the numbers tell me what’s wrong.
No more guesswork on where you’re weak, you now have a precise target for where you’re lacking and how to fix it. Suddenly “I feel like I’m slow” becomes a concrete prescription for getting fast. The sprint is all about breaking down a different kind of energy use into various phases while maintaining the technical purity of the movement. By breaking off the drive phase from the cruise phase from the fade phase, you’re no longer in pursuit of an unattainable goal. You’re conditioning the very pieces that comprise the race itself.
The stopwatch doesn’t tell you why. The stopwatch won’t lie, but it will fail to provide answers. That’s your job.”