Spin Class Power Calculator
Estimate indoor cycling watts, calories, W/kg, FTP percentage, power zone, class training load, and weekly output from cadence, resistance, duration, and rider details.
📌Spin Class Presets
Spin bikes vary by brand and maintenance. This calculator estimates useful training trends from cadence, resistance, effort, and calibration rather than claiming lab-grade power.
⚙Class and Rider Inputs
Spin class power estimate
Enter class details to estimate watts, calories, FTP share, and weekly load.
📊Spin Class Metrics
📑Reference Tables
| Step | Formula | Inputs | Use |
|---|---|---|---|
| Base watts | RPM curve x resistance | Cadence, resistance | Console-style estimate |
| RPE correction | Base x effort factor | RPE 1-10 | Reality check |
| Calibration | Watts x bike factor | Calibration % | Bike drift adjustment |
| Energy | Watts x seconds | Power, time | kJ and kcal |
| Zone | FTP % | Class feel | Typical block |
|---|---|---|---|
| Recovery | Under 55% | Easy spin | Warmup or cooldown |
| Endurance | 56-75% | Steady talkable | Base ride |
| Tempo | 76-90% | Firm control | Long songs |
| Threshold | 91-105% | Hard sustained | Power intervals |
| VO2 | 106-120% | Very hard | Short attacks |
| Scenario | Cadence | Resistance | Planning read |
|---|---|---|---|
| Recovery ride | 75-90 rpm | 20-35 | Low load |
| Rhythm ride | 85-105 rpm | 30-50 | Mixed aerobic |
| Heavy climb | 55-75 rpm | 55-80 | High torque |
| HIIT class | 90-115 rpm | 40-70 | High surges |
| Input quality | Confidence | Best use | Watch for |
|---|---|---|---|
| Power meter bike | High | Zones | FTP freshness |
| Calibrated studio | Good | Trends | Bike variance |
| Console estimate | Moderate | Class compare | Resistance scale |
| RPE only | Low | Effort notes | Day-to-day fatigue |
💡Spin Power Tips
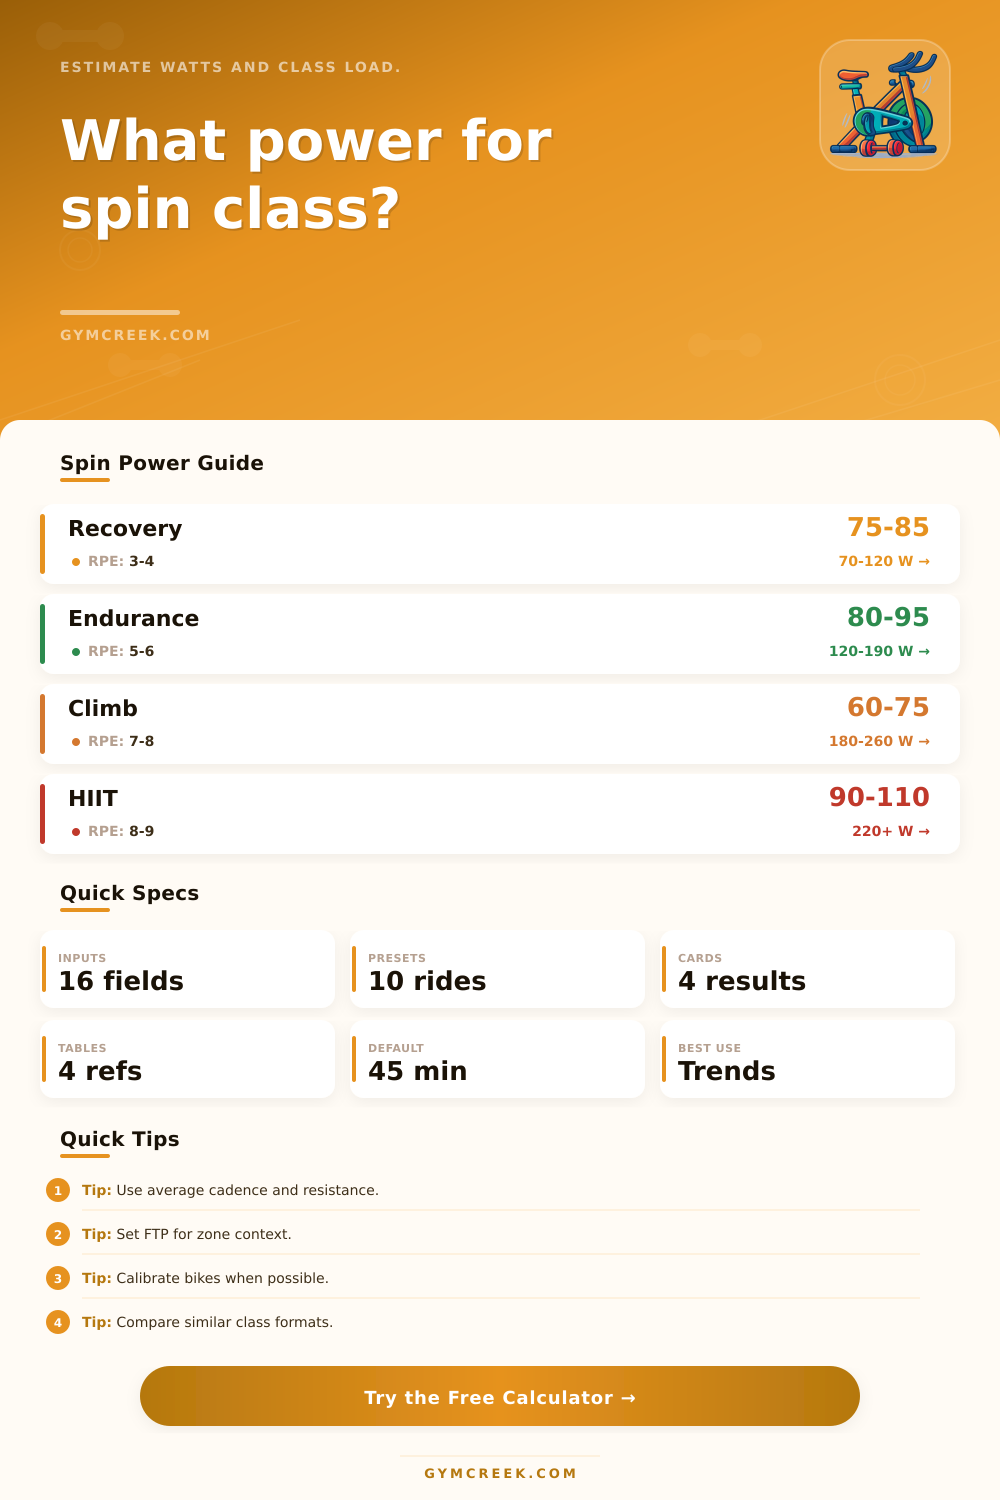
How does a spin class feel powerful? It’s all kind of mystical…until you stop and notice: what is actualy turning that flywheel? Force come from both cadence and resistance, and yet two rider on the same bike might post radically different numbers based off their consistency applying that force. Plug in a few rider details plus your cadence and resistance, and the calculator will do the math for you, no need to guess at how that translates into training load and watts.
Resistance knobs gets all of the attention, but few remember that cadence magnifies their impact: A slight bump from low to mid-range in revs per minute will produce greater wattage then an extra five clicks on the resistance knob if you pedal sluggishly. To reflect that dynamic, tool doesn’t track power along a straight line, but instead charts a curve, which matches actual bike behavior as soon as you approach a given speed. It compensates for how long you spend standing. Doing out-of-the-saddle work increase muscle demand regardless of what’s displayed on the console.
How to Measure Your Spin Class Power
But that gives those watts some context, knowing your FTP. The calculator will also estimate your zones based on how hard you say you’re working. This is fine for tracking trends. But with FTP, you’ll know if most of the time are spent in endurance territory or pushing past threshold again and again. Sharpening race-specific fitness isn’t the same than building an aerobic base.
The weekly output numbers reflect class length (and how often per week) as well as load: it doesn’t all add up during one session but over time. You get a different training effect from three 45-minute classes done at moderate power compared to two longer and harder ones. However, many rider only record their feelings on any given day. That’s where the calculator come in; it lets you see if what you’re doing now is really what you want to do.
On that page, you’ll see they lay out various class formats. Rhythm rides are typically moderate resistance with a higher cadence, while climb sessions is lower cadence with more resistance. They use these as a guide for what it should of feel like on your power meter in power terms. It’s less “each class is its own beast” and more “I know this feels like an 80 on my power, so I can read my numbers relative to that.”
Calibration drift is the silent variable that gets people. If you have an under-reading bike, it will keep hiding how much you’re improving. If you have a studio bike that’s reading high, it’ll convince you of more strength than you possess. Allow the estimate to shift with your equipment by entering in a calibration factor. You might take a class on two very similar bikes and find your legs tell you they felt just the same. However, your watt number might look quite different until you account for calibration bias. It doesn’t change the math. But it does change how the results are interpreted.
For an athlete focused on power, the same ride will be viewed as both a percentage of their FTP and how much effort it requires. Someone focused on fat loss will see it as total calories burnt. They’re both right. But each points them towards different tweaks to make in subsequent rides. Stop looking at spin class power as just a single number. Instead, look for patterns over time, such as weeks. The calculator then gives you a reliable way to track those patterns, regardless of the differences between the various bikes.