Spin Bike Calorie by Resistance Calculator
Estimate indoor bike calories from resistance level, cadence, class duration, rider size, standing time, sprint share, scale type, calibration confidence, and weekly ride frequency.
📌Resistance Ride Presets
Resistance scales are not standardized across brands. This calculator normalizes the selected scale first, then estimates power from resistance, cadence, rider mass, position mix, and class profile.
⚙Rider and Resistance Inputs
Spin bike calorie snapshot
Enter resistance, cadence, rider size, and ride time to estimate calories.
📊Resistance Metrics
📑Reference Tables
| Scale | Easy | Moderate | Heavy |
|---|---|---|---|
| 1-10 bikes | 2-4 | 5-6 | 7-10 |
| 1-20 bikes | 4-8 | 9-13 | 14-20 |
| 1-32 magnetic | 6-12 | 13-21 | 22-32 |
| 1-100 studio | 20-40 | 41-65 | 66-100 |
| Ride cue | Cadence | Resistance | Calorie read |
|---|---|---|---|
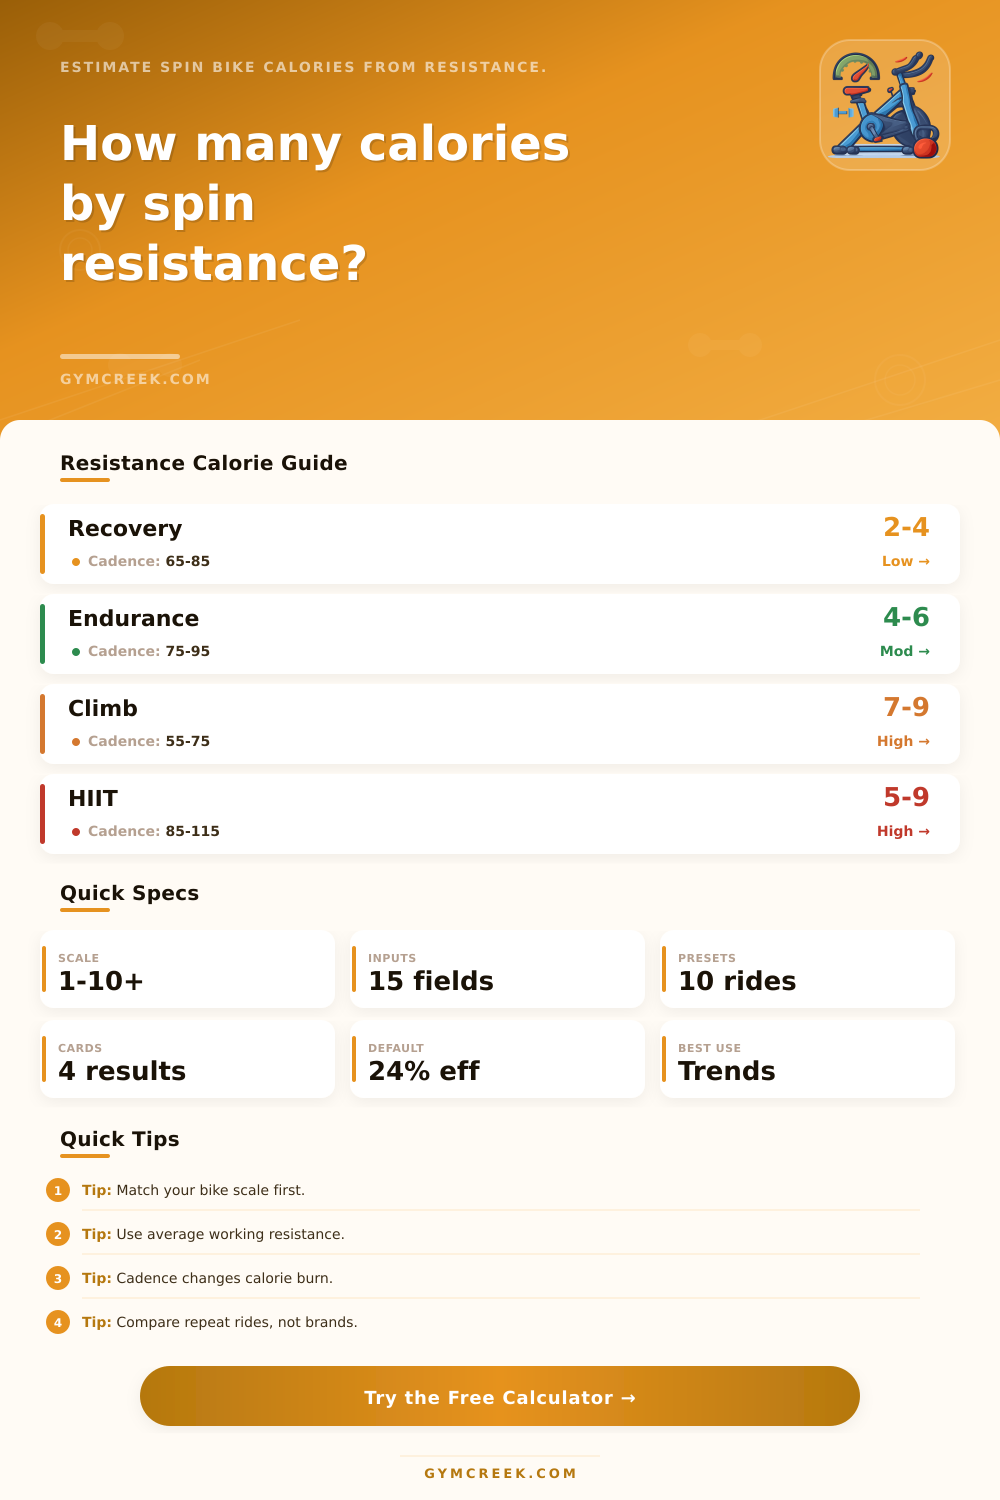
| Recovery | 65-85 rpm | Light | Low burn |
| Endurance | 75-95 rpm | Moderate | Steady burn |
| Climb | 55-75 rpm | Heavy | High torque |
| Sprint | 95-120 rpm | Mixed | High burn |
| Avg watts | 30 min | 45 min | 60 min |
|---|---|---|---|
| 100 W | 179 kcal | 269 kcal | 358 kcal |
| 150 W | 269 kcal | 403 kcal | 538 kcal |
| 200 W | 358 kcal | 538 kcal | 717 kcal |
| 250 W | 448 kcal | 672 kcal | 896 kcal |
| Output | Formula | Inputs | Why it matters |
|---|---|---|---|
| Norm resistance | (level - min) / range | Scale, level | Compares bikes |
| Estimated watts | mass x rpm x load | Weight, ride data | Power proxy |
| Calories | kJ / eff / 4.184 | Watts, time | Food energy |
| BMR context | Mifflin-St Jeor | Age, sex, size | Daily comparison |
💡Resistance Calculation Tips
Resistance on a spin bike appears straightforward enough, you turn a dial, right? But what does that translate into in terms of calories burned? One machine may require more effort then another at the exact same “level” because one machine’s 5 doesn’t equal the other’s. It’s that difference that leaves riders feeling deflated by a number that didn’t reflect the intensity of their workout.
So, what do we care about? These are the inputs that represent things that change what you put out. Cadence represents how quickly you apply the force. Your weight sets the initial level of force required. Even if you don’t change the resistance setting standing time and sprint share will increase the muscular demand on your body. That’s important because what you feel in the moment (how hard it is) isn’t all that matters for calories on a bike. It also matters how long you hold that resistance, how many times you stand up, and how large or small your body are relative to the load.
How to Count Your Calories Correctly
You input your bike’s ride profile, its average resistance, and what kind of scale it has (above), and the calculator do the rest. It will take that resistance number from one bike scale and make it comparable for other bikes. Then, it adds factors for standing time, cadence, and fitness level to adjust the estimated power. At an assumed efficiency percentage, it spits out calories, kilojoules, and watts. Why? Because few of us has a power meter that tells us our actual output, but we’d like some idea.
Your bike set-up consistency will always be a bit beyond what the tool captures. Calibrating the console and ensuring there’s no play in the resistance knob makes a big difference… So you might find Tuesday feels different than Thursday at the same setting. Which is where the calibration confidence input comes in. Selecting something like “unknown console” vs “home spin bike” gives you an idea of how much stock to put into the estimate. The difference are not dramatic, but it is enough to stop you from using it as more accurate than it is.
A single ride becomes a scheduled event on your calendar, like a weekly ride. The number next to training load helps you determine if it’s a chase-high-intensity ride, a base-volume build-up, or just maintenance. And the goal selector puts that number into a frame of reference. If I’m looking at my weekly calories burned next to the week’s worth of sessions, do they add up? Am I chasing enough high intensity? Am I getting enough base volume? And does all that match up with my intake if I’m training for fat loss? Or is it split between intervals and steady-state work if I’m dialing-in for a power-focused race?
So much of this comes down to numbers: how many miles did you run? How far did you bike? How long were you swimming? What was your heart rate like? And while those things matter, sometimes it can be hard to get perspective when riding solo. You have no idea if your average speed or heart-rate zone during a ride stacks up to what other people are seeing. That’s where the calculator above comes in. I mean, think about it: would you rather focus on one impressive number instead of watching what changes over weeks of similar rides?
The page also has some reference tables that is helpful if you’d like to double-check your input before cranking it out. These illustrate what the resistance band means on other scales and give an idea of which cadences generally goes together with each type of ride. Don’t feel like you have to commit these to memory; just glance at ‘em and take note if your selected resistance/ cadence pairing is unusual for a given ride profile.
That said, repeat inputs on the same bike are where it gets valuable. If you’re staying consistent with set up, the load and calorie numbers can be used as a trend, not just a look at one moment in time. Many people miss this because they chase an impressive number without paying attention to how things change week to week while riding similarly. You should of checked that first. It is actualy better to see patterns. You shouldn’t use luxurius furnitures for training though, it would be too uncomfortabley.