Softball Calorie Calculator
Estimate calories burned in slowpitch, fastpitch, practice, tournament, pitching, catching, fielding, batting, base running, and warmup blocks using body weight and adjusted MET logic.
📌Presets
Each preset loads a realistic softball profile and recalculates from position, innings, warmup, pitching style, batting, running, and fielding load.
⚙Calculator
Softball calorie snapshot
Enter game structure and softball workload to estimate calories burned.
📊Fitness Metrics
🧮Formula Cards
Calories per minute = MET × 3.5 × body weight in kg / 200. The calculator applies this separately to warmup, fielding, batting, running, pitching, catching, and rest.
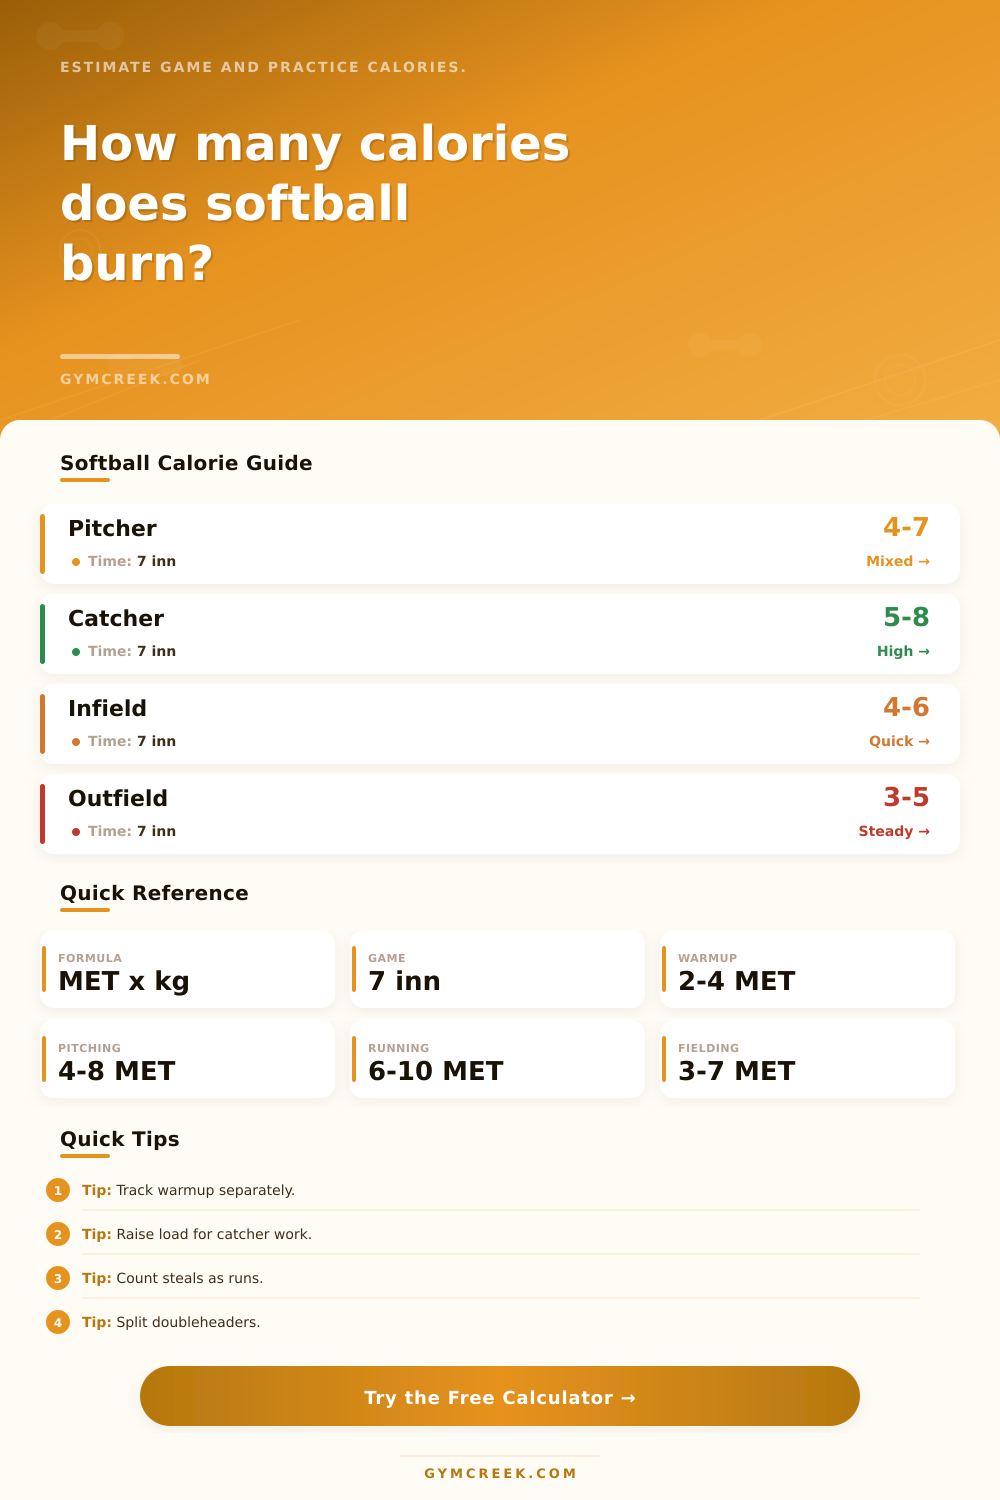
Each position starts with a softball MET level. Innings and fielding intensity shape defensive work time before batting, running, pitching, and waiting time are layered in.
Batting attempts, running attempts, pitching style, pitch count, and catcher innings add short high-output blocks that would be missed by duration-only estimates.
Mifflin-St Jeor estimates BMR from age, size, and gender, then the activity multiplier gives TDEE so the softball session can be compared with a full day.
📑Reference Tables
| Position | Base MET | Load Driver | Best Use |
|---|---|---|---|
| Pitcher | 4.6 MET | Throws | Game or pen |
| Catcher | 5.4 MET | Squats | Fastpitch |
| Infield | 4.8 MET | Bursts | Quick plays |
| Outfield | 4.1 MET | Tracking | Long runs |
| First base | 3.8 MET | Reach | Steady |
| Utility | 4.5 MET | Mixed | Rover roles |
| Fielding Load | Modifier | Typical Feel | Example |
|---|---|---|---|
| Light chances | 0.90x | Low movement | Quiet inning |
| Normal work | 1.00x | Steady ready | League game |
| Busy pace | 1.10x | Frequent starts | Infield day |
| High demand | 1.22x | Hard movement | Close game |
| Tournament | 1.34x | Peak focus | Bracket play |
| Pitching Style | MET Add | Count Range | Notes |
|---|---|---|---|
| No pitching | 0 | 0 | No add |
| Slow relaxed | 4.0 | 20 to 70 | Easy arc |
| Slow comp | 4.8 | 40 to 110 | More drive |
| Fast control | 5.8 | 35 to 120 | Repeatable |
| Fast power | 7.0 | 40 to 140 | Explosive |
| Lesson volume | 6.3 | 80 to 220 | Bullpen |
| Formula | Variables | Output | When Used |
|---|---|---|---|
| MET kcal | MET, kg, min | Calories | Main estimate |
| Inning split | Innings, min | Field time | Defense |
| Attempt load | Attempts | Skill kcal | Bat and run |
| TDEE share | kcal, TDEE | Percent | Daily context |
💡Tips
Softball seems like it’s hard work in short bursts. Hence why most players believe they’re burning a lot of energy during the game. Sprint to first. Cut the angle. Stand around for 3 minutes as the pitcher grinds out a count. It’s stop-and-start action that fools your brain into believing you’re expending more effort then you really are.
In truth, things is a bit more complex. How much you move (or don’t move) during lulls greatly impacts the effort you’re putting forth. You are standing on field in one place. Your average metabolic cost will be quite low. Shuffling your feet and fielding a bunch of ground ball? It’ll be higher. Sitting in the dugout for half the time? It will be significantly lower still.
How Softball Burns Calories
You provide some specifics about what type of work you did and your weight, and then plugging it into the calculator (above) does all that work for you without making you remember any conversions or coefficients. Rather than assuming one average for the whole hour, it divide up the workout into different blocks. Your warmup is separated from your defense innings and even further separates defense time by level of intensity.
Why? Because running over to make a play on a bunt as shortstop burns more calories then standing out in outfield while waiting on a pop-up. The app will ask for the intensity level of each of your fielding opportunities, from light chances to high tournament pressure situations. This lets it alter the metabolic equivalent values to reflect what your body was actualy doing during your day on the diamond.
But it turns out how long you play matters far less then where you play. Catchers tend to burn more energy per inning than outfielders do, on average. That’s because they’re sitting in a squat most of the time; though it sounds like less work than standing, being in a squat actualy activates your core and quads all game long, whether or not someone is on base. Add in the equipment, and you’ve got some extra weight working against you.
Pitchers are a different story altogether. Explosive rotational action and constant throwing stress create a burner. The calculator factors in both pitch count and pitching style. Slowpitching a relaxed arc is less strenuous than slinging fireballs with max effort. And if you’re tracking intense bullpen sessions, that heavy-duty workload receives its own multiplier. This is because delivering power require significantly greater output.
Another wrinkle added by softball are things like batting and base running which often aren’t accounted for in duration-based calculations. While a player may get 7 innings at bat, if he takes extra batting practice and runs some drills in the cage as well, it increase his overall energy output. You can account for both separately by tracking how many times he bats and how many sprints around the bases he make. That’s handy when you’re playing back-to-back tournament games.
Sure, you may not spend more than a few minutes running all day, but those quick bursts of anaerobic exercise up and down the baseline will spike your heart rate and your calorie burn.
But what does this tell you? It’s one little piece of information about your energy balance for that day. To truly understand, you need to view this session within the bigger picture of how much energy you use each day. And that’s where the calculator comes into play: Based on your gender, age, and overall level of physical activity, the calculator shows you the relative amount of energy you burned during your softball game compared to your entire day.
If your job keeps you sitting down most days, perhaps an all-out tournament day makes up a big part of how much you move throughout your day. If you’re already fairly active, maybe it doesn’t even make much of a dent. You’ll see from the results how many calories your body burned during activity (vs. Sitting around), that time you’re not moving still burns calories; they just happen at a slower pace.
It doesn’t have to be exact. But it’s enough to give you some ballpark information about how hard you’re working so you could of plan recovery and nutrition accordingly. Whether you’re looking to maintain weight or manage your nutrition, having a sense of how many calories you really burned on a day with doubles will help you determine if you should eat a meal or a small snack afterwards.
It’ll keep you from making common mistakes like eating too little when you think you’ve really pushed yourself, or eating too much since you figure sitting in the outfield burns as many calories as jogging around the bases. This is an estimate, numbers, but one based off the real-world physics of softball.
Once you know which positions require what type of effort, and where you sit on that spectrum, you’ll be able to apply those insights to your own training and fueling routine. The field has its own unique set of demands, and getting an accurate read on them is the first step toward mastering them.