Sodium Potassium Ratio Calculator
Compare daily sodium and potassium intake, estimate Na:K balance, check targets, add sweat sodium context, and view fitness metrics from one day of tracking.
📌Ratio Presets
Presets load complete daily logs with demographics, calories, sodium, potassium, sweat loss, fluid, processed-food share, and tracking confidence. Edit any field after loading one.
⚙Daily Intake Inputs
Sodium to potassium ratio
Enter a full-day log to compare sodium, potassium, mineral density, and training context.
📊Nutrition Metrics
📑Reference Tables
| Na:K | Read | Common driver | Review |
|---|---|---|---|
| Under 0.6 | Potassium rich | High produce | Maintain trend |
| 0.6 to 0.9 | Balanced | Mixed whole foods | Repeat log |
| 0.9 to 1.4 | Sodium leaning | Packaged meals | Check labels |
| 1.4+ | High sodium tilt | Restaurant foods | Review pattern |
| Mineral | Reference | Adult note | Calculator use |
|---|---|---|---|
| Sodium | 2300 mg | General limit | Target cap |
| Potassium male | 3400 mg | Adequate intake | Male ref |
| Potassium female | 2600 mg | Adequate intake | Female ref |
| Potassium DV | 4700 mg | Food label DV | Label context |
| Output | Formula | Inputs | Purpose |
|---|---|---|---|
| Na:K | Sodium / potassium | mg, mg | Main ratio |
| K:Na | Potassium / sodium | mg, mg | Inverse view |
| Density | mg / kcal x 1000 | mineral, kcal | Food quality |
| BMR | Mifflin-St Jeor | kg, cm, age | Fitness context |
| Measure | Value | Reference | Signal |
|---|---|---|---|
| Na:K ratio | --- | 0.6 to 0.9 | Enter values above. |
📋Scenario Reference
| Profile | Sodium | Potassium | Na:K |
|---|---|---|---|
| Whole-food day | 1800 mg | 3600 mg | 0.50 |
| Mixed training day | 2700 mg | 3400 mg | 0.79 |
| Restaurant day | 4400 mg | 2500 mg | 1.76 |
| Heavy sweat day | 3200 mg | 3900 mg | 0.82 |
| Source | Band | Meaning | Action |
|---|---|---|---|
| Rough estimate | +/-25% | Wide range | Retest |
| Mostly labels | +/-15% | Useful log | Compare |
| Weighed portions | +/-10% | Better day | Trend |
| Weekly average | +/-7% | Stable view | Update plan |
💡Ratio Tips
For decades we’ve had a nutritional imbalance, most folks fear sodium but ignore potassium. You might still feel guilty about the “salt” on the label even if you eat spinach, but spinach provide the mineral your body needs most. It’s not just how much salt you’re eating. What are you eating with that salt?
Your body doesn’t care about sodium by itself. It cares about relationship between sodium and potassium. Sodium and potassium affects blood pressure, fluid balance, and muscle contraction during exercise.
Why You Need to Balance Sodium and Potassium
It doesn’t require you to know whether your diet is overly reliant on processed meals. The calculator does that for you when you feed it your daily food log. And you don’t have to be a biochemist to figure out what goes into it either. If you eat lots of packaged goods and restaurant meal, you’ll tend to have higher sodium. On the other hand, if you cook at home a lot using fresh ingredients, you tend to have high amounts of potassium which you find in things like beans, dairy, fruits and veggies.
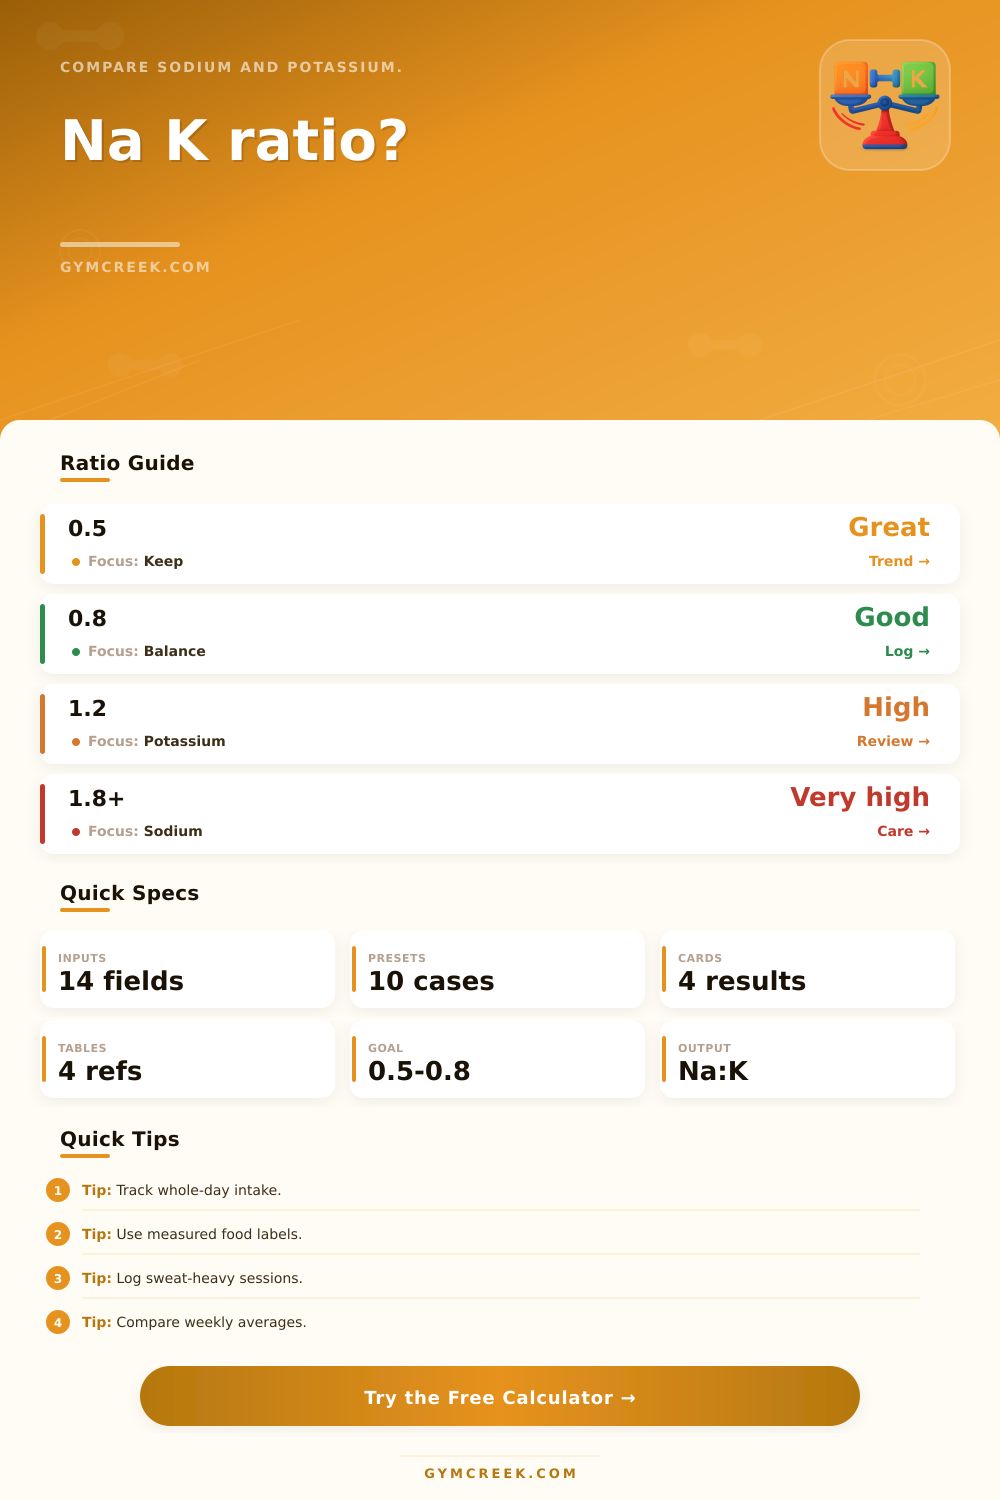
By comparing those two, the tool tells you how you stack up. Ideally, you want a number less then 0.6, as this indicates that your potassium intake has sufficiently offset your sodium intake. That’s generally referred to as a plant-forward diet. And it might look very different than what most people envision when they think about healthy eating.
It gets even trickier if you factor exercise into the equation. If you’re exercising long enough, and certainly during hot weather, you lose a ton of sodium through sweat. Fail to account for that, and you’ll assume that you’re taking in too little sodium. To compensate for that, you can enter an estimate of how much you sweat out and have the tool account for that in its view of how much you need each day. That’s important if you’re exercising at a serious level because the difference between a “rest” day and a marathon training run will impact your sodium needs significantly.
It doesn’t mean that you need to get the magic number correct every single day. Rather, it means understanding the overall picture over time. There’s a big range of error when people try to estimate what they ate or just remember one meal. If you weigh your portions and look at food labels, that makes a big difference in accuracy.
This table shows how much confidence in tracking affects how reliable results are. If you’re guessing, take the results with a grain of salt. If you log carefully, you can be more confident in the numbers. It’s all about direction, not being perfect. It’s more helpful to know if you’re moving towards greater balance than to get hung up on one day where you were off.
To examine the quality of calories instead of just how many (i.e. To look for good nutrients in every calorie), the calculator also computes mineral density per thousand calories. For example, you might eat a massive quantity of low-calorie crap with no nutritive worth, the metric will reveal whether your calories count. If the sodium density is high, it’s probably processed. If the potassium density is high, it’s probably real. It is a small detail but it matters for long-term health and performance.
Of course, it’s easier for some to think about potassium (the first number) as driver in this equation. So we provide the inverse ratio too, which is just as obvious when you’d like more potassium than sodium. Most of us eat too little potassium and too much sodium, so most diets today is failing on this front.
It doesn’t mean you need a drastic diet overhaul. You can simply add more veggies to all your meals and read ingredient labels on snacks and sauces. Use the calculator to see what this looks like before you make it a habit.
Bottom line: This is a balancing act. Sodium is necessary for our bodies. That doesn’t mean you should of remove all salt from your diet. But you want potassium to counterbalance sodium. Consider it a see-saw. If one side gets too much weight, the whole thing tips over. By tracking these two nutrients together, you’ll have full picture. It will put a number to abstract health advice.
Begin with a baseline, log what you eat for one day. Then pick one small tweak (next week) and log that as well. Balance isn’t a destination; it’s a daily routine. The trend will be the truth.