Sled Drag Calorie Calculator
Estimate calories, mechanical work, pace, load ratio, and density for forward or backward sled drags on turf, rubber, grass, concrete, or a custom surface.
📌Sled Drag Presets
Each preset changes bodyweight, sled load, distance, surface friction, speed, direction, rounds, and rest ratio before calculating.
⚙Calculator
Sled drag snapshot
Enter load, distance, friction, bodyweight, speed, rounds, and rest ratio to estimate the session.
📊Metrics Grid
📑Reference Tables
| Surface | Typical friction | Session feel | Tracking note |
|---|---|---|---|
| Indoor turf | 0.25-0.35 | Smooth and repeatable | Best for comparing weeks |
| Rubber flooring | 0.35-0.55 | Grippy and slow | Small load jumps feel large |
| Grass or field | 0.45-0.70 | Uneven and heavy | Record weather and lane condition |
| Smooth concrete | 0.15-0.30 | Fast but variable | Sled feet can change friction |
| Direction | Demand bias | MET tendency | Best use |
|---|---|---|---|
| Forward harness | Hips, calves, trunk | Moderate-high | Conditioning and strength |
| Backward drag | Quads and knee extension | High | Quad work and knee-friendly volume |
| Hand strap | Upper back plus legs | Moderate-high | Heavy marching repeats |
| Lateral drag | Adductors and hips | Moderate | Change of direction strength |
| Result range | Calories per minute | Training density | How to read it |
|---|---|---|---|
| Easy flush | 4-8 | Low | Recovery or warm-up work |
| Steady conditioning | 8-14 | Moderate | Repeatable work capacity |
| Hard intervals | 14-22 | High | Strong conditioning stimulus |
| Max effort drags | 22+ | Very high | Short bouts with longer rest |
| Formula piece | What it uses | Output | Why it matters |
|---|---|---|---|
| Friction force | Sled mass x g x coefficient | Newtons | Shows horizontal drag demand |
| Mechanical work | Force x distance | Kilojoules | Compares sessions across surfaces |
| MET estimate | Bodyweight, speed, load, direction | Calories | Captures whole-body effort |
| Rest ratio | Work time and recovery time | Session total | Changes density and calorie rate |
💡Tips
The physical stress that occurs from dragging a sled filled with weight are unique. It’s felt across your lower back, calves, and hip. It’s rhythmic and heavy work, and at times you’ll be gasping for breath.
But what about its metabolic cost? How many calories it burned? The cost to move a sled can’t easily be estimated. Simply guessing based off your sweatiness won’t cut it. Lifting vertically involve different physics than dragging horizontally does. While the former is pulling against gravity, the latter is fighting against friction.
Why You Need This Sled Calculator
By entering in your speed, surface friction and load, the calculator do all the math for you. No need to derive coefficient yourself. And friction is the silent variable which can ruin your training log. On one hand, you may believe you’re completing the exact same workout on Friday as you did on Tuesday. But what if the turf was dry on Tuesday but wet on Friday? The resistance probably doubled!
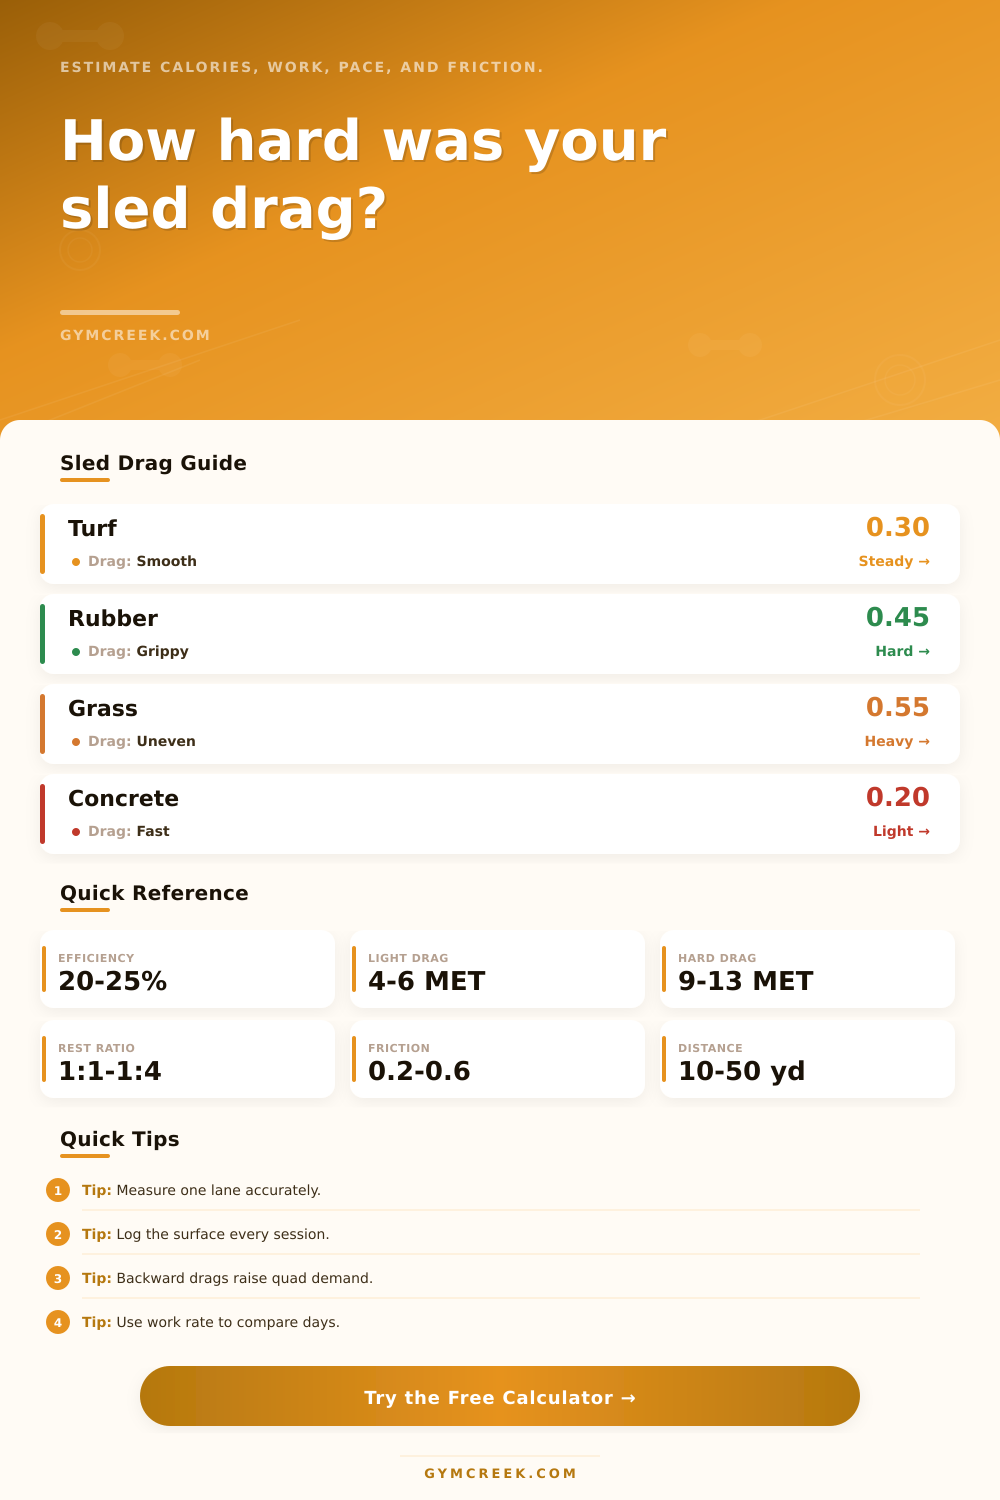
Indoor turf has a smooth feel with a friction coefficient around 0.30. That same sled on grass can feel as though it is fighting you at a 0.55 coefficient. By allowing you to adjust the coefficient, tool takes into account this factor. It directly affect both the estimate of calories burned and mechanical work performed. Without taking this into consideration, your perceived effort won’t match your actual output. Your progress will stall and you’ll get frustrated.
Where you go matter. A forward drag from a harness use less quad muscle than dragging a sled backward. That’s because the workload isn’t the same; it’s a different set of body movement. The calculator accounts for that directional bias. The extra work required by the knee extensors during backwards drags cause that increased stress. And here’s where the direction makes sense: Your workouts are designed to hit certain weak spots and avoid stressing out other muscles.
Forward drags will have a different balance than lateral drags. Those lateral pulls bring in the hip flexor and adductors while also providing a new kind of stability you don’t get with forward pulls. Knowing these directional preference lets you adjust the workout to match.
Many athletes undercut their own progress with how they use rest intervals. Going with a 1:1 work-to-rest ratio means low overall session time but very high-intensity effort. On the other hand, going with a 1:4 ratio means nearly full recovery. This changes the drill from a conditioning grind to a power development tool. Rest times factor in to both total session time as well as calorie estimate in the calculator. That provides you with an accurate picture of what it will take to make your time spent worthwhile.
Another hidden lever is mechanical efficiency. The human body isn’t a perfect engine. About 20-25 percent of our energy output are converted into usable work. The remainder is converted to heat, which is why you get hot while doing sled work. This efficiency setting lets you adjust the estimate to be more personal. Some folks create more power while creating less metabolic waste, and that’s recognized here.
But there’s a better way, tracking your sessions accuratly allows for progress. Unless you know the exact surface, friction, and direction, you are flying blind. Sure, you can add some plates and lift more. But since the surface changed from rubber to grass, the true force requirement could of stayed the same or decreased.
The page has all that spelled out in the reference tables. This lays out how different surfaces change the feel of the drag. Low friction concrete feels fast and light. Heavy gripping rubber slows you down and grips hard. Measure how much actual work is being done, not just weight being moved. Turn subjective exhaustion into objective data with tool.
You’re not looking to pull a sled around until you pass out. First, I think it’s important to have an idea of what your body is asking you to do. Numbers makes us train smarter. They help us compare weeks, tweak our rest period, adjust load, etc. They turn the grinder into a calculated process.
Next time you’re lacing up for a sled session, take a few minutes to look at conditions. Let the numbers set what you expect. Yes, the sled will suck. But how much does it suck?