Running Power Zones Calculator
Estimate running critical power, watts per kilogram, terrain-adjusted targets, and workout zones from a recent field test or known rFTP.
📌Presets
Each preset loads a specific runner profile, test method, terrain setting, and workout target before calculating.
⚙Calculator
Running power snapshot
Enter a test power and calculate your zones.
📊Metrics Comparison
🎯Calculated Zone Bands
📑Reference Tables
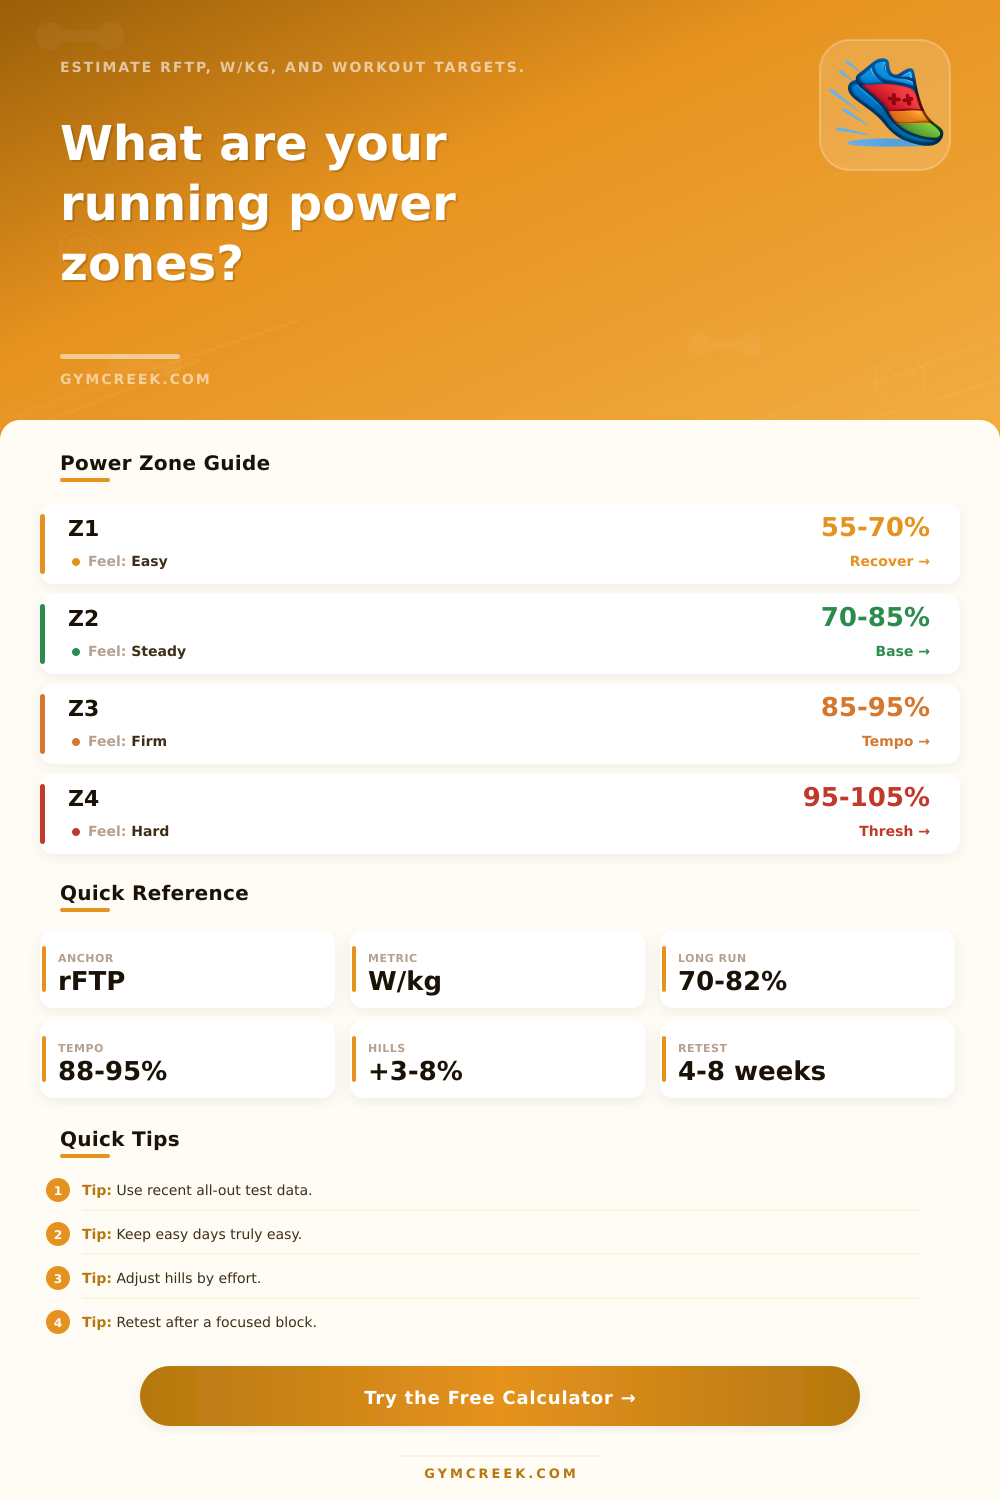
| Zone | % rFTP | Feel | Typical Use |
|---|---|---|---|
| Z1 Recovery | 55-70% | Very easy | Warm-ups, cooldowns, recovery runs |
| Z2 Endurance | 70-85% | Comfortable | Long runs, base mileage, aerobic durability |
| Z3 Tempo | 85-95% | Steady hard | Marathon power, steady tempos, controlled climbs |
| Z4 Threshold | 95-105% | Hard controlled | 20-40 minute threshold work and strong 10K effort |
| Z5 VO2 | 105-120% | Very hard | Short intervals, hill reps, fast finish surges |
| Test | Input | rFTP Factor | Best When |
|---|---|---|---|
| Known rFTP | CP or rFTP | 100% | You trust device history or lab testing |
| 3-minute | All-out watts | 84% | You need a fast update after a block |
| 9-minute | Hard TT watts | 94% | You want a balanced field estimate |
| 20-minute | TT watts | 95% | You can pace a sustained effort well |
| 30-minute | Race effort | 98% | You have recent race-like data |
| Terrain | Adjustment | Power Note | Use Case |
|---|---|---|---|
| Road or track | 0% | Cleanest comparison | Testing and intervals |
| Gravel path | +2% | Slight rolling resistance | Base and steady runs |
| Rolling trail | +5% | Variable stride cost | Trail tempo and climbs |
| Technical trail | +8% | Power may lag effort | Use RPE alongside watts |
| Treadmill | -1% | Stable surface | Controlled indoor work |
| Metric | What It Shows | Strength | Limitation |
|---|---|---|---|
| rFTP / CP | Sustainable power | Sets training zones | Needs regular retests |
| W/kg | Power relative to mass | Compares hills well | Not a full race predictor |
| Zone time | Training distribution | Controls intensity | Device zones must be current |
| Target watts | Workout execution | Useful on hills and wind | Needs effort cross-check |
💡Power Training Tips
Your watch is a tachometer, not a speedometer, meaning most of us treat it as if it’s telling us how fast we are running, whereas it realy tells us our heart rate and pace after a few minutes. That’s why we see a lag with chasing down a friend up a hill or surging to catch up on flat ground.
Running power does something different. It measure your mechanical work in real-time, removing variables such as gradient, wind chill, and even leg fatigue to provide you with one number representing your pure output. Plug your test data into the calculator above and it will do the math for you. No need to guess at conversions and coefficients, just get zones that represent your current level of fitness.
Why Running Power Is Better Than Pace
Most folks don’t have a direct read in for their functional threshold power. Instead they use short field tests to estimate it. These can be thing like a 20 minute time trial, or a three minute all out effort. Depending on how long the test lasts, certain factors is applied to your average watts. The shorter and harder test are discounted slightly. A longer, steadier effort tends to be treated more as what your actual ceiling is.
That’s a good nuance because you don’t want to set your zones too high due to some sort of adrenaline spike. You might also set them too low because you are being conservative at the start. All you really need is one honest number based off of a recent run, to anchor the system. The moment it’s anchored, the calculator breaks your ability into different bands for each type of work.
Your mileages should resides in the lower zones. Why? Because they build aerobic endurance while minimizing fatigue. I think a lot of people struggle with this aspect of training, since they see relatively low numbers in terms of power and assume they need to do more. Nope. Low-intensity work increases size of your engine. And when your engine is bigger, you’ll be able to maintain higher intensities later on.
Specific stress goes in the upper zones: You drill up to speed and/or push your threshold here. But these need to be done precisely in order to provide any use. Going just 10 watts above your goal will turn an effortless tempo run into a sloppy threshold session, and leave you gassed for tomorrow.
The problem is terrain. Gravity’s not consistent and it doesn’t forgive. Five percent isn’t merely tiring. It greatly increases the power required (meaning: the watts you’ll need to go as fast). Your tool can accounts for average grade and type of riding surface. This allows you to set realistic targets as the road becomes rough or the trail turns technical. You don’t need to chase the same wattage on a steep trail that you would on flat pavement, but you do need to understand how much more you are actualy working.
But you will have an idea of what additional work is being done, and that’s key. It avoids frustration, and ensures your perceived effort matches up with your physiologic zones.
Weight also plays a quiet but important role. The more power you produce compared to your weight, the more efficient you’ll go up hill. The metric that removes size-bias here is watts per kilogram. That’s your fitness level based on your own bodyweight. And it means that when you see someone who has the same absolute power output as you do, they may be running a much faster time than you during a hilly race course. That’s because their w/kg number is higher then yours.
This is what the calculator takes into account. You get a portable measure that remains consistent across runs where your gear and shoes changes a bit. The wildcard is fatigue. No device can perfectly predict this until it’s too late. Accumulated training load, sleep debt and heat will shifts your performance down before you even notice it. That’s why adding a little buffer to your targets helps bridge that gap. This fills the gap between what your body can really deliver on a hard day and what your watch tells you.
It’s better to have energy at the end of a run. You avoid chasing a number too aggressively and blowing up in the last few miles. These zones aren’t a rigid rule but more of a guide. Every few weeks adjust based off how your fitness has changed. The goal isn’t just to hit a number. It’s to know the engine you’re driving and to be able to push it a bit harder without burning yourself out. You should of prepared for the hills.