Running Functional Threshold Power Calculator
Estimate running FTP from a field test, convert it into training zones, and compare power, pace, and power-to-weight for road, trail, and treadmill sessions.
📌Running Presets
Each preset loads a realistic running power test setup and recalculates the threshold model.
⚙Calculator
Running FTP snapshot
Enter a test effort to calculate threshold power, pace, and zones.
📊Metrics Comparison
📑Reference Tables
| Test Method | Formula | Use Case | Caution |
|---|---|---|---|
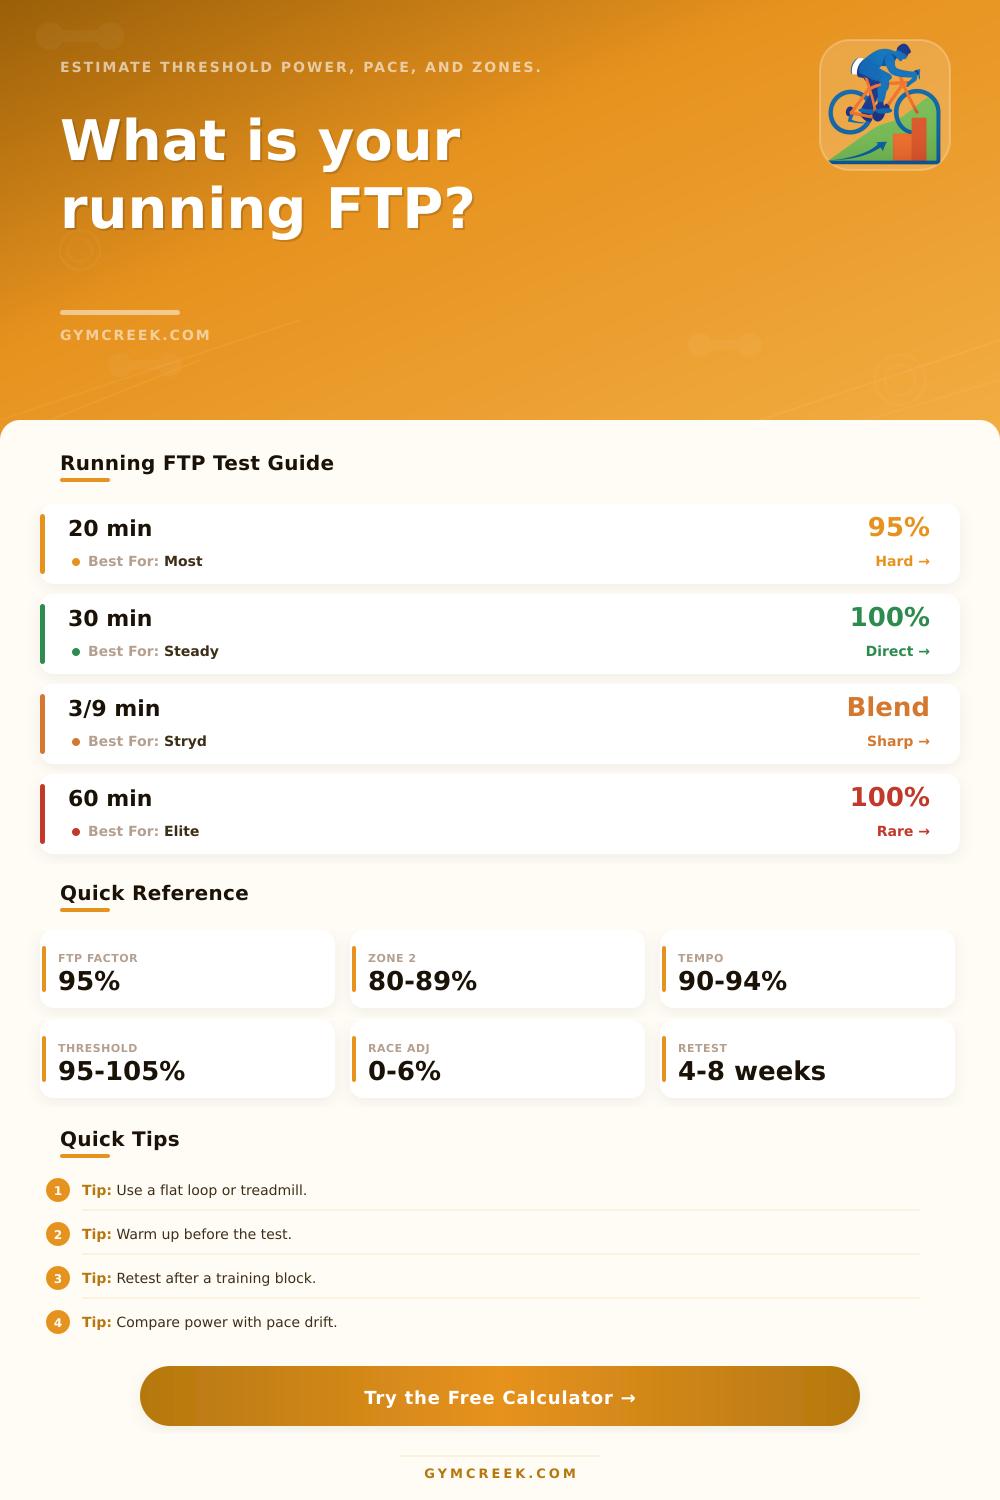
| 20 minute field test | FTP = 95% of 20 min watts | Most runners with power | Pace the first 5 min evenly |
| 30 minute steady test | FTP = 100% of 30 min watts | Experienced threshold runners | Requires strong pacing control |
| 3/9 critical power | CP from 3 and 9 min work | Power meters with short test data | Needs full recovery between bouts |
| 60 minute race effort | FTP = 100% of race watts | High-level athletes | Very demanding to execute |
| Zone | % FTP | Feel | Common Session |
|---|---|---|---|
| Recovery | <68% | Very easy | Shakeout runs |
| Endurance | 68-79% | Conversational | Long aerobic runs |
| Steady | 80-89% | Controlled | Marathon work |
| Tempo | 90-94% | Firm | Long tempo blocks |
| Threshold | 95-105% | Hard sustainable | Cruise intervals |
| VO2 | 106-120% | Very hard | 3-5 min repeats |
| Runner Profile | FTP W/kg | Typical Focus | Power Note |
|---|---|---|---|
| New power runner | 2.5-3.2 | Easy durability | Watch pace drift |
| Recreational racer | 3.2-4.0 | 10K to half | Retest after blocks |
| Competitive amateur | 4.0-4.8 | Threshold density | Fine tune terrain |
| Elite road runner | 4.8+ | Race specificity | Use direct test data |
| Terrain | Power Pattern | Adjustment | Best Check |
|---|---|---|---|
| Flat road | Smooth watts | 0% | Pace repeatability |
| Rolling road | Small surges | 1-2% | Normalized power |
| Technical trail | Spiky output | 3-5% | Effort stability |
| Treadmill | Steady output | 0-1% | Calibration match |
💡Power Testing Tips
Power meters are not magic wands; they’re tools. Raw watts fluctuates based off cadence, wind, and terrain, which means what you see on screen doesn’t always reflect how hard you’re working. That’s where functional threshold power comes in.
Your FTP is the greatest amount of wattage you can maintain for about an hour. As a guide, it’s an anchor for all of your training zones below it.
How to Use Your FTP for Training
That’s where this one test becomes a valuable framework. Your latest hard effort gets plugged into the calculator. It calculates your starting place, and then you’re off to the races. You don’t have to do any more math on your own (well not much) to get your VO2 max intervals or tempo runs figured out.
Those numbers is done for you so you can avoid the mathematical error that most of us make with our math when we try to figure out percentages. That derails our plan for the week. It helps save you from making manual calculation errors that can derail your weekly plan.
Finally, decide on the proper test protocol. The industry standard is 20 minutes all out with a 5% deduction. It’s accurate enough but also keeps a person sane because nobody can maintains max threshold for a whole hour. Most who do ends up overdoing it initially and crashing at the end.
Whether you opt for a longer lasting effort or shorter field test, the same factor are applied to your result. Try to select something that feels like it’s within your means while remaining honest.
The pacing of the test is also important. Some people begin with an adrenaline-fueled surge and fade toward the end of the test. In general, it’s best to have a smooth finish; don’t try to start too fast. An outlier where your normalized power differ greatly from your average is an indication that you may have gone out too hard early on in the test.
The variance is not a sign of fitness but rather inefficiency. That variance is a small thing, but it matters greatly for how much weight you should of give the result.
Because of the terrain, your high watts when running over technical trails or on rolling hills mean you’re going to appear to be able to produce higher levels of aerobic power than you really can. Normalized power smooths those fluctuations better than average power, while still letting you account for surface type in the calculator. You want an FTP that is reflective of what your engine outputs, not how gnarly the road gets.
If you treat a hilly test as a flat one, you’ll blow up your FTP which will make your next easy run feel like a tempo. And that leads to burnout.
Once you’ve got your number, the zones translates into a training map for you. They’re broken down nicely by percentage and help you run really slow easy runs and make sure your hard efforts is really sharp. It’s very easy to get stuck in the gray area where most amateurs live, doing work that neither increases speed nor builds an aerobic base. Having a precise threshold lets you cut out all that junk mileage.
Do you want to sharpen speed or build endurance? You can’t do both well at the same time, so pick one.
Measuring once isn’t enough. Weight fluctuations, fatigue, and fitness all impact your FTP, so you should retest every four to eight weeks to get an accurate read on where your current zones lie. It’s about accuracy in following through with a training plan, not chasing higher numbers.
So when you find that your power has remained stagnant while your threshold pace has drifted away, it’s probably environmental factors and not a lack of form. It’s more about consistent functional threshold power than max watts. Winning the test isn’t necessary. You just want to set a solid baseline that you can consistently work at during the day.
Instead of chasing spikes, it’s about learning to work in zones so you know what direction progress is coming from, and you know how to sustain it. It’s a system where data doesn’t confuse the effort; it guides it.