Rowing Age Handicap Calculator
Estimate a fair age-adjusted rowing time from age, sex category, distance, raw finish time or split pace, age factor, handicap saved, category comparison, and handicap bands.
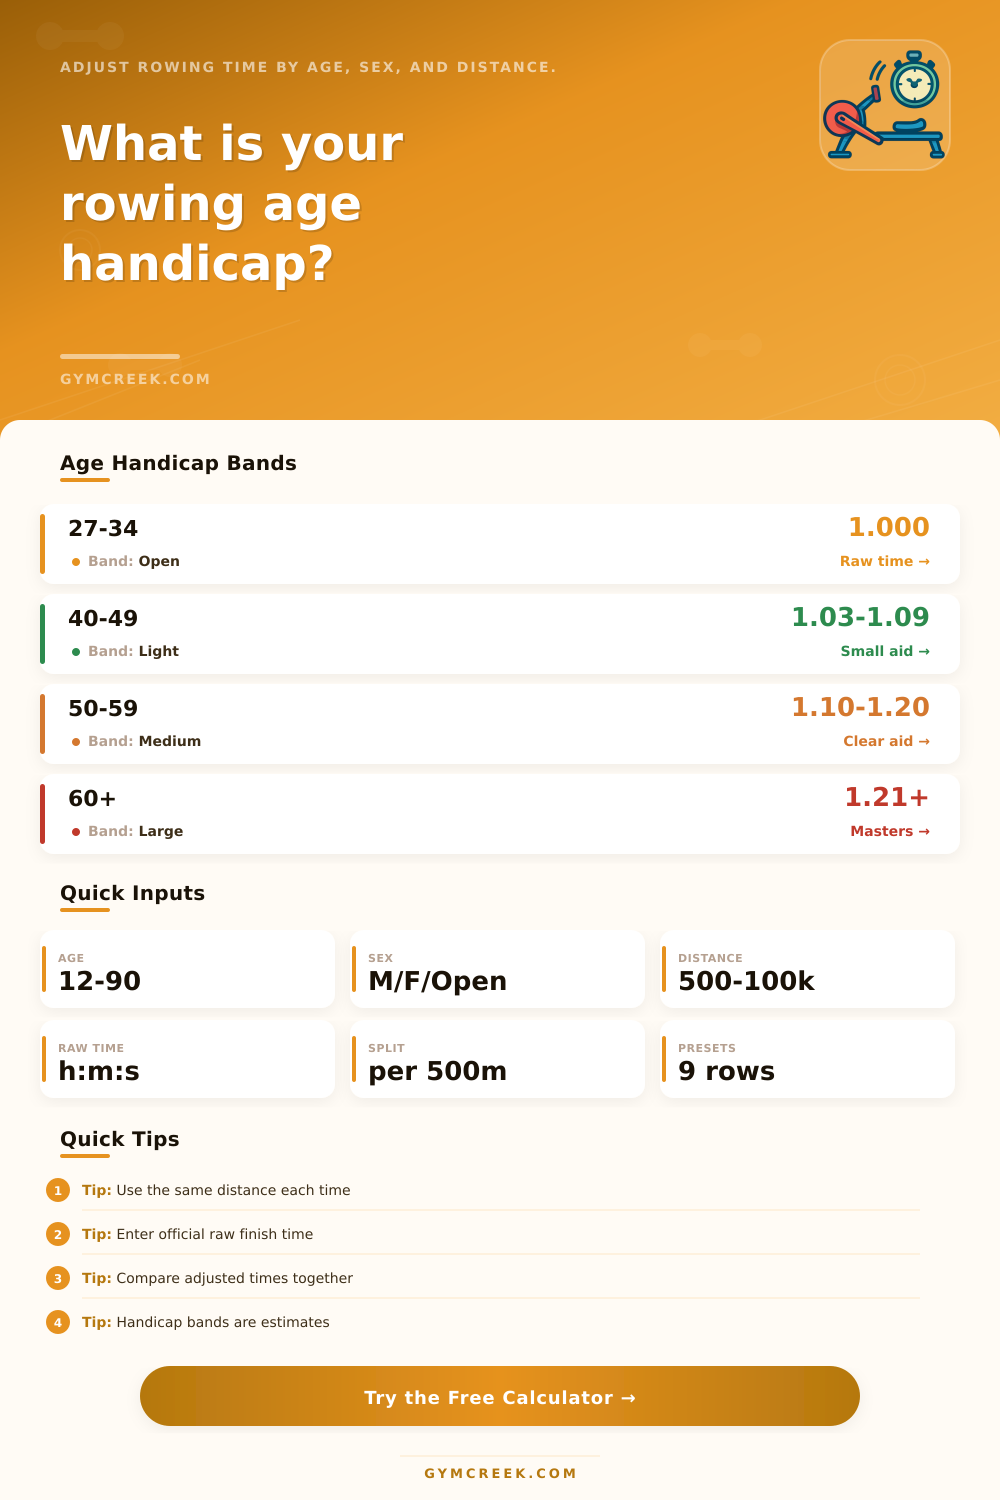
📌Rowing Handicap Presets
Presets load common erg challenge scenarios. This calculator uses a transparent club-style estimate, not an official federation ranking table.
⚙Calculator Inputs
Age-adjusted time ready
Enter your row details and calculate to compare raw and adjusted performance.
📊Comparison Metrics
🏁Category Comparison
📑Reference Tables
| Age range | Typical factor | Handicap band | Interpretation |
|---|---|---|---|
| 12 to 26 | 1.000 to 1.010 | Junior or developing | Small youth allowance only at younger ages. |
| 27 to 34 | 1.000 | Open baseline | Raw time and adjusted time are usually the same. |
| 35 to 44 | 1.010 to 1.060 | Light handicap | Early masters adjustment, often modest. |
| 45 to 54 | 1.060 to 1.150 | Moderate handicap | Noticeable time allowance for category comparison. |
| 55 to 64 | 1.150 to 1.280 | Strong handicap | Masters correction becomes a major comparison factor. |
| 65 plus | 1.280 plus | Large handicap | Use exact event rules when prizes or records matter. |
| Saved percent | Band | What it means | Best use |
|---|---|---|---|
| 0% to 2% | Open | Little or no time allowance applied. | Open age comparison. |
| 2% to 6% | Light | Age factor helps but raw pace still dominates. | Mixed club boards. |
| 6% to 12% | Moderate | Adjusted time materially changes ranking. | Masters events. |
| 12% to 20% | Strong | Handicap is a central part of comparison. | Wide age fields. |
| 20% plus | Large | Use published local factors if available. | Formal handicaps. |
| Distance | Class | Raw split matters | Handicap note |
|---|---|---|---|
| 500 m | Sprint | Acceleration and rate heavy. | Short rows receive a slight sprint curve. |
| 1000 m | Short test | Power plus pacing control. | Good for masters club ladders. |
| 2000 m | Standard race | Most common erg benchmark. | Default distance factor is centered here. |
| 5000 m | Endurance | Split stability matters more. | Longer pieces slightly smooth the factor. |
| 10000 m plus | Long row | Durability and pacing dominate. | Compare like distances only. |
| Piece | Formula | Input | Output |
|---|---|---|---|
| Raw seconds | time or split x distance / 500 | Finish time or split | Baseline seconds |
| Age factor | 1 + age curve + sex and distance modifiers | Age, sex, distance | Estimated factor |
| Adjusted time | raw seconds / factor | Raw time and factor | Handicapped finish |
| Time saved | raw seconds - adjusted seconds | Both times | Handicap allowance |
| Split | seconds x 500 / distance | Any finish time | 500m pace |
💡Tips
The ergometer age handicap calculator allow a person to compare there performances to others in various age group. Because a person’s body change with age, and because a person’s ability to recover from exhaustion change with age, it is more fairer to adjust their time for age. The ergometer age handicap calculator utilizes various informations to create an adjusted figure for each person, which allow that person to compare their results to another individual in a different age bracket.
To utilize the calculator, a person must input field for there age on the day of the race, there sex category, the distance that they rowed, and the time that they posted on the ergometer. Each of the inputs for the calculator can alter the results of the calculation that the calculator makes. For example, the calculator uses a persons age as one of the main variables.
How the Ergometer Age Handicap Calculator Works
However, the distance that they rowed may also have an effect upon that age-related calculation of time. For instance, a 500 meter sprint will reward a person for there explosive power, which tend to decline with age. In contrast, a 10,000 meter row will reward a person for there ability to maintain a consistent pace, which declines at a