Rowing 2K Predictor Calculator
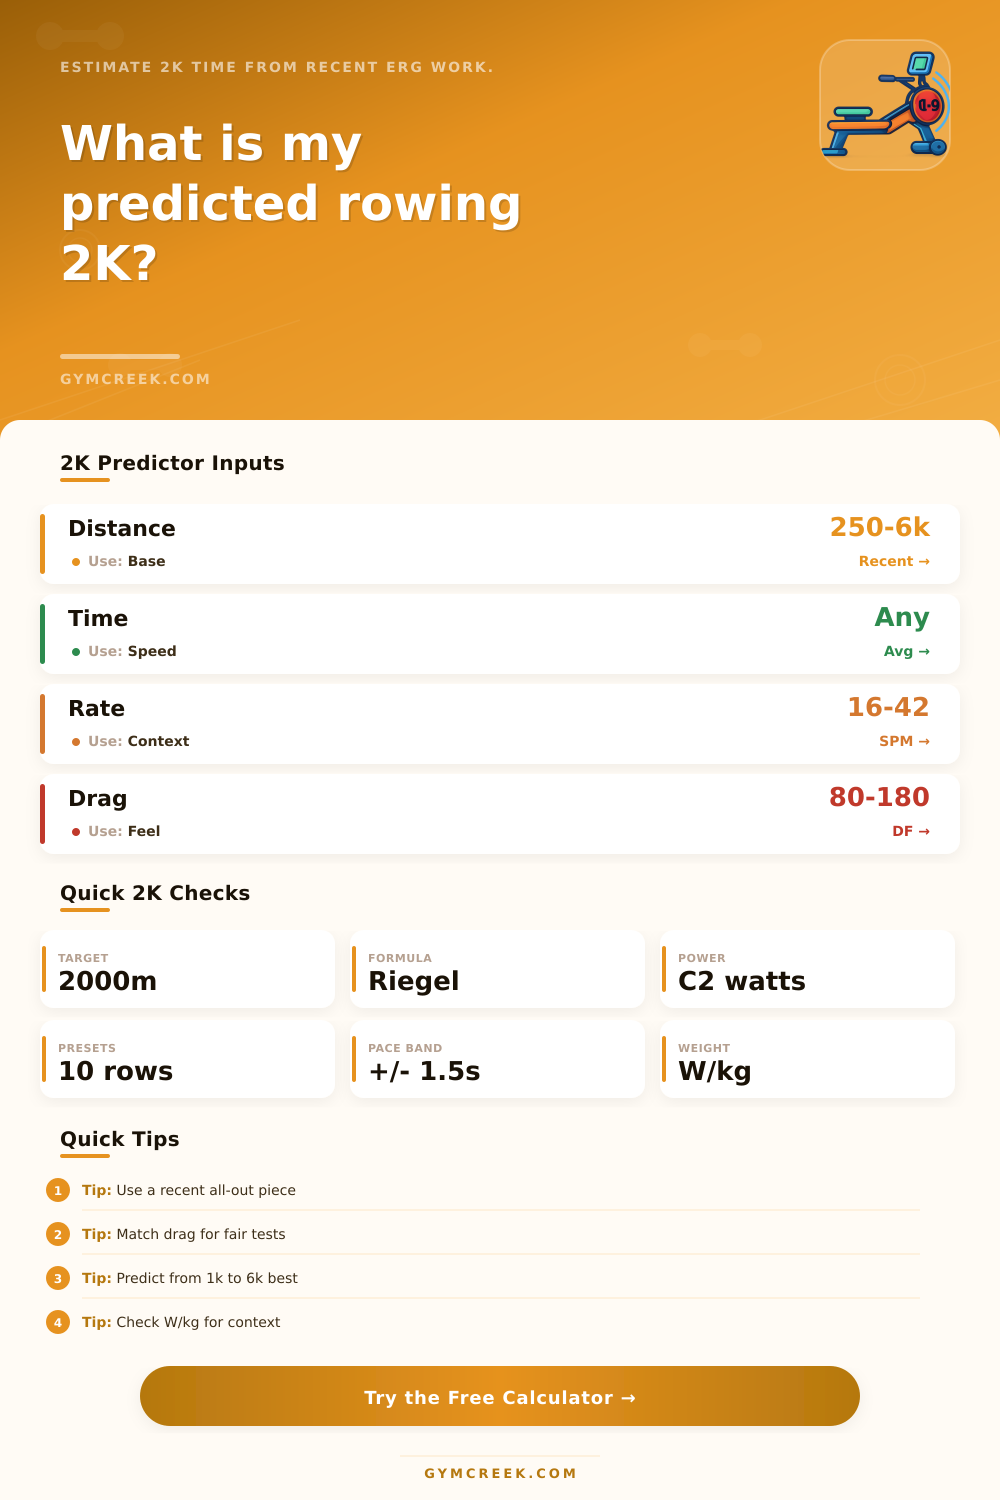
Estimate your 2000m erg time from a recent benchmark, then inspect predicted split, watts, W/kg, pace band, fatigue curve, rate, and drag context.
📌Presets
Presets load realistic rowing profiles and calculate immediately. Use them to compare how benchmark distance, readiness, and experience change the 2K projection.
⚙Calculator
Predicted 2K snapshot
Enter a recent erg benchmark to estimate 2000m time, split, watts, and pacing.
📊Rowing Metrics Grid
📑Reference Tables
| Benchmark | Accuracy | What it shows | Watch |
|---|---|---|---|
| 500m | Low | Peak power | Overpredicts |
| 1000m | Good | Race speed | Pain tolerance |
| 1500m | High | 2K pace fit | Finish strength |
| 5000m | Good | Aerobic base | Underpredicts |
| 6000m | Good | Endurance | Rate gap |
| 2K split | 2K time | Watts | Use |
|---|---|---|---|
| 2:10 | 8:40 | 157 W | Novice |
| 2:00 | 8:00 | 203 W | Fitness |
| 1:50 | 7:20 | 263 W | Club |
| 1:40 | 6:40 | 350 W | Strong |
| 1:30 | 6:00 | 480 W | Elite speed |
| Model | Best for | Adjustment | Risk |
|---|---|---|---|
| Balanced | Normal tests | Blended | Moderate |
| Conservative | Short tests | More fade | Safer |
| Aggressive | Tapered rows | Less fade | Harder |
| Experience | All rows | Curve shift | Self-rate |
| Formula | Variables | Output | Use |
|---|---|---|---|
| Riegel | T1,D1,D2 | 2K time | Main curve |
| C2 watts | Split | Power | Erg output |
| W/kg | Power, kg | Relative | Compare rows |
| J/stroke | Watts, spm | Drive work | Rate check |
📋Predicted 2K Pacing Table
| Segment | Split target | Power cue | Execution note |
|---|---|---|---|
| 0-500m | Calculate | Settle | Load a result |
| 500-1000m | Calculate | Hold | Load a result |
| 1000-1500m | Calculate | Commit | Load a result |
| 1500-2000m | Calculate | Finish | Load a result |
💡Tips
A 2000-meter piece on the erg sits right at the edge of what most people can sustain. It is too long to finish with pure grunt power alone, but it’s not long enough to simply rely on steady strength. So when you have that tension, this become a useful prediction tool.
Feed in your bodyweight, a recent benchmark, and information about how you feel during the row (fresh or tired?). Are you tired? The math will account for stroke rate, drag factor, your distance fatigue, and then adjust accordingly. That’s where the benchmark distance comes in as the key input.
How to Use the Prediction Tool
For example, a peak power number might show up nicely in 500-meter sprint, but not much will tell you about its endurance properties over eight minutes. Meanwhile, an 8K can give you a better idea of your aerobic capacity, but it might undervalue how fast you’ll be able to sustain yourself over a shorter race. To account for these differences, the calculator adjusts with what it calls a fatigue exponent, calculated based off your test distance from 2000 meters.
The higher the fatigue value, the more adjustment you sees. The more similar your benchmark and target distances are, the more accurate prediction will be. This is why recent 1500 or 2000-meter efforts yield the most accurat estimates.
For these same reasons it also matters if athlete is experienced and ready to go. Running a solid 5K on an exhausted day shows that he or she have deeper aerobic reserves than the raw number indicates. On the other hand, someone with an elite rowing background who has trained specifically for 2Ks for many years can produce more power while feeling same level of effort as a novice.
With this tool, you can account for both of those variables, and have final estimate represent not an idealization of athlete but who they are when they get on the machine on race day. Watts per kilogram appears on the output because relative power tends to be a stronger predictor of race results different than straight-up wattage; two athletes may have identical raw numbers, but the one with less mass is approaching her/his ceiling.
The W/kg number tells you if that projected time is reasonable at this moment’s body weight and if getting down or up several kilogram will make a significant difference in outcome. That one number gets translated into a pace table that follows, which most of us can execute.
In theory, most rower understand their target split. Not as many understand how it should feel at each 500-meter mark as they are fatiguing and the monitor continues to display the same number for seemingly forever. Depending on your race strategy, the table provides cues, step by step, to help you achieve it. Whether you opt for an even split, a slight negative or a controlled start with a big push at the end, it all applies.
Another mistake is treating the prediction as a target instead of a range. There are multiple reasons why actual performance will differ (illness, sleep, etc.) so the calculator already incorporates a safer-to-stretch band. To avoid overreacting on any one good/bad day, you should of think of using the band as a decision tool, not just a number.
The real value of running these numbers regularly is not the prediction itself. The purpose of running it this way, regularly, isn’t really the number at all. It is the process of holding yourself to same set of assumptions on each piece.
Then, you look back across time to see how difference between predicted and actual 2K times changes. If the gap narrows over weeks or months, you know you’re adapting to your training in exactly the ways the race requires. If the gap grows, you have a warning. One or more elements of your training (intensity, volume, recovery) is out of whack and should be fixed before the next test day.