Rolling Resistance Calculator
Estimate rolling force, grade force, athlete power, work, session calories, and relative training demand for wheels, sleds, tires, carts, and loaded fitness efforts.
📌Presets
Presets load realistic Crr values and movement speeds. Adjust the coefficient if you have measured rollout data for your tires, wheels, sled, or surface.
⚙Calculator
Rolling resistance snapshot
Enter mass, speed, coefficient, surface, and grade values to estimate force and training demand.
📊Fitness Metrics Comparison Grid
📑Reference Tables
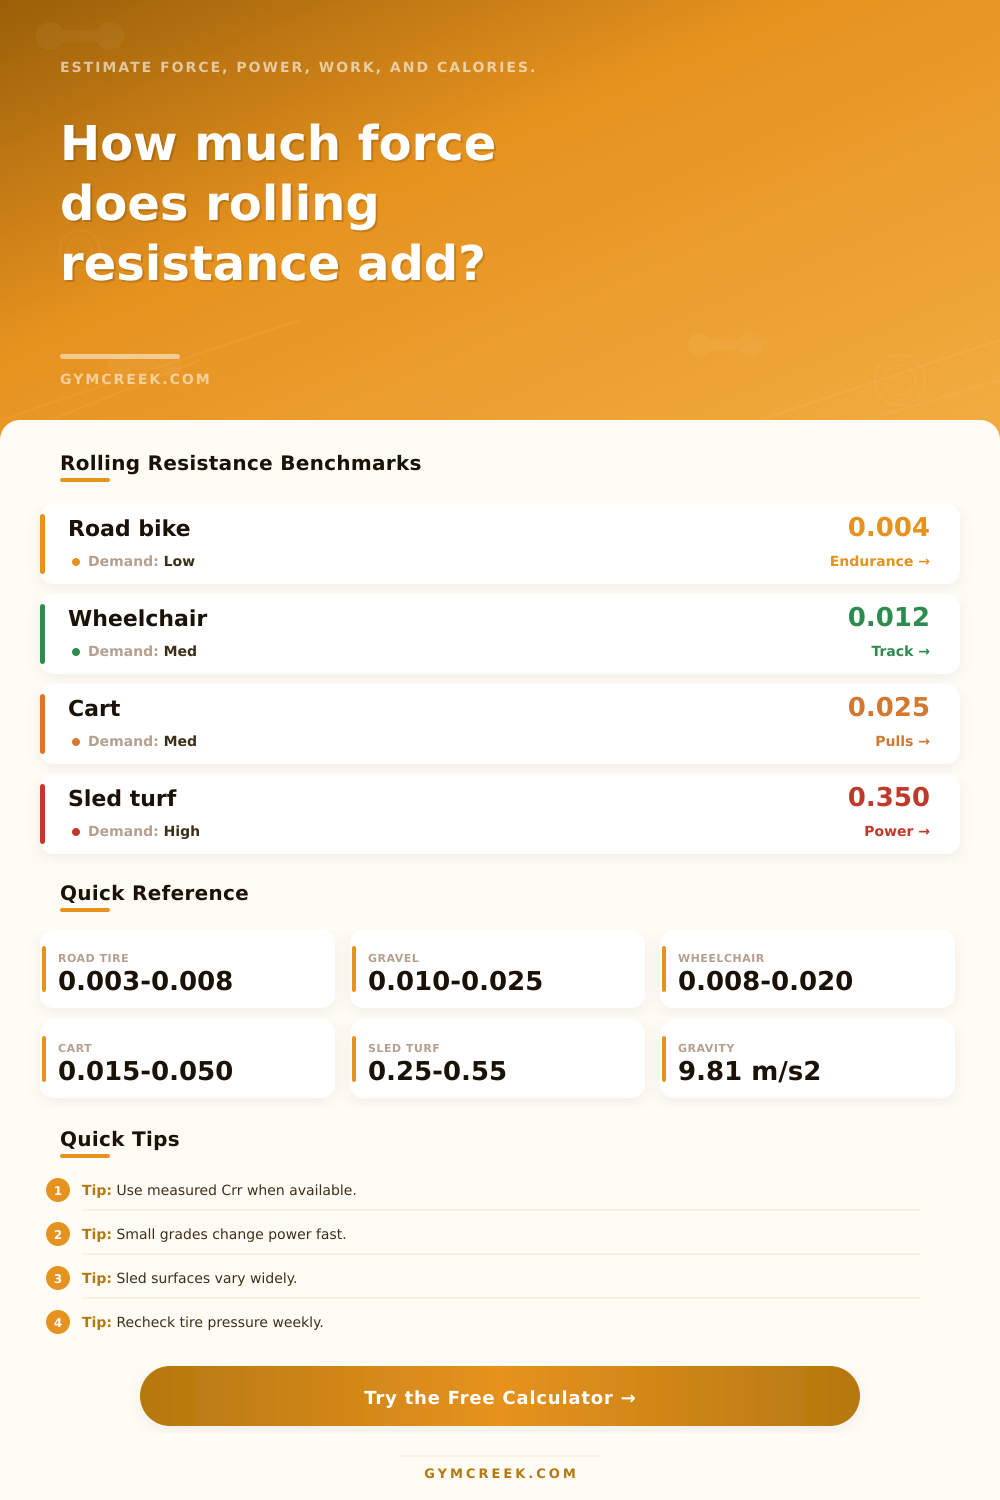
| Setup | Typical Crr | Training Feel | Notes |
|---|---|---|---|
| Performance road tire | 0.003-0.006 | Low | Smooth pavement, correct pressure |
| Hybrid or trainer tire | 0.006-0.012 | Low to moderate | More casing and contact loss |
| Wheelchair court setup | 0.008-0.020 | Moderate | Tire type and camber matter |
| Loaded cart on concrete | 0.015-0.050 | Moderate | Small wheels raise demand |
| Gravel or rough road | 0.010-0.030 | Moderate | Surface vibration adds loss |
| Prowler or tire drag | 0.250-0.550 | High | Closer to sliding friction |
| Force per kg | Demand | Common Example | Training Use |
|---|---|---|---|
| Under 0.08 N/kg | Very low | Fast bike tire | Long endurance |
| 0.08-0.20 N/kg | Low | Wheelchair or cart | Technique and volume |
| 0.20-0.60 N/kg | Moderate | Soft tire, rough route | Steady strength endurance |
| 0.60-2.00 N/kg | High | Light sled or drag | Intervals and power |
| Over 2.00 N/kg | Very high | Heavy sled on turf | Short acceleration work |
| Scenario | Mass | Crr | Expected Result |
|---|---|---|---|
| Road cycling | 90 kg | 0.005 | About 4-5 N rolling force |
| Wheelchair track | 85 kg | 0.012 | About 10 N rolling force |
| Cart pull | 120 kg | 0.025 | About 29 N rolling force |
| Loaded stroller hill | 105 kg | 0.018 | Grade often dominates |
| Sled turf push | 170 kg | 0.350 | Hundreds of newtons |
| Formula | Variables | Output | Use |
|---|---|---|---|
| Normal force | m x g x cos grade | Newtons | Load on surface |
| Rolling force | Crr x normal force | Newtons | Main resistance |
| Grade force | m x g x sin grade | Newtons | Climb or descent effect |
| Power | force x speed | Watts | Instant demand |
| Work | force x distance | Joules | Session load |
| Calories | work / efficiency | kcal | Metabolic estimate |
💡Tips
We all know that wind is one of the major forces resisting us, since at high speeds, air realy does fight back hard. But what about the ground? If you’ve pushed a heavy shopping cart on grass or other uneven terrain, then you know that ground put up its own fight. That’s called rolling resistance, and it’s an invisible tax on your energy use. Whether you’re aiming for a few more seconds off of your race time or simply determining how much work it’ll take to pull a loaded sled through the gym, this have meaning.
Once you enter in the details of surface and your mass into the calculator above, the rest of the math is done for you… No need to guess at coefficients and conversions.
What Is Rolling Resistance?
Rolling resistance is essentially all about deformation. Your tire deforms when it contacts the ground and so does whatever are under it. Most of that energy doesn’t get released back out; instead, it gets absorbed in heat. With a softer tire, there is greater deformation, more of a footprint of the tire on the ground. And it sink further into the asphalt. That means there is even greater deformation as the tire constantly squeezes and you lose more power with every squeeze.
The beauty of this tool is that you can adjust for how your bike ride. If you use soft suspension or low tire pressure for better traction or comfort, the coefficient rises. This create a balance between mechanical efficiency and ride quality.
But here’s where the surface makes all the difference. If it’s smooth (like concrete), then the bike glides along easily as there isn’t too much deformation from ground. But transition to something soft like grass or loose gravel and the tire will sink into the terrain. It forms a little hump you have to climb back up again and repeat over and over. That’s what makes riding gravel bikes more strenuous then your typical road bike, even at similar speeds.
To make up for this, the calculator include surface condition multipliers. If it’s rough, muddy, or wet, you can add a bit to the resistance number. This shows that even if the tire is in great shape, you’ll need plenty of power to keep moving on such a lousy surface.
This one isn’t as much about aerodynamics as it is about weight. Your speed and shape determine most of the aerodynamic drag, while amount of weight you’re placing on the wheels is directly related to rolling force. Whether you have extra plates on a prowler sled, a kid in a stroller, or just a bunch of cargo, the increased weight push down onto the ground harder. It deforms the surface more, which results in more energy loss. That’s why the difference between adding 20 pounds to a car versus adding 20 pounds to a bike feel very different. That added weight is going to be a much larger fraction of the overall weight of the light vehicle, and will be much more apparent when pushing off your legs.
What about gradients? These complicate things further. For example, a small upward slope will increase the normal force a little. This is what cause your weight to push down harder against the ground. However, it primarily adds more gravitational force that has to be overcame separately from rolling friction. You’ll notice the tool breaks out these forces for you and lets you visualize which one is taking most of your energy.
When you’re up a steep incline, gravity wins. But if you have bad tires on a flat road, maybe the rolling resistance are the greater drain. Knowing this can help guide your decision: should I change my gears or adjust my tire pressure?
Force is where most casual estimates end, but it’s the metabolic cost that makes the data useful for training. To arrive at its estimate of calories burned, the calculator factor in human efficiency and converts mechanical work to calories spent. Because we’re not perfect engines, we expend only roughly twenty to twenty-five percent of the energy we burn as forward motion; the rest goes toward internal friction and heat. This efficiency rating add a more realistic picture to how tired you’ll be feeling an hour later. It links the world of physics and the world of physiology.
But you don’t need perfect data to begin with. Their presets give you decent enough baselines based off typical activities such as using a wheelchair on a track or road cycling. Start there and adjust accordingly if your power numbers feel off. For example, if their calorie estimate feels too low, bump up the surface multiplier. You’ll see just how sensitive the system can be to real world variables when you make small tweaks.
Rolling resistance is silent but it compounds quickly over longer distances. Whether that means picking a smoother route or making sure your tires are properly inflated, knowing what you’re paying for helps you drive smarter.