Respiratory Exchange Ratio Calculator
Convert measured VO2 and VCO2 into RER, estimated fat and carbohydrate use, caloric equivalent of oxygen, and session energy output.
📌Presets
Presets load realistic gas exchange examples across rest, endurance, threshold, interval, fasted, and carbohydrate-fed conditions.
⚙Calculator
RER and fuel snapshot
Enter VO2, VCO2, body weight, duration, and training context to calculate RER.
📊Fitness Metrics Grid
📑Reference Tables
| RER | Estimated Fuel | Carb Share | Fat Share |
|---|---|---|---|
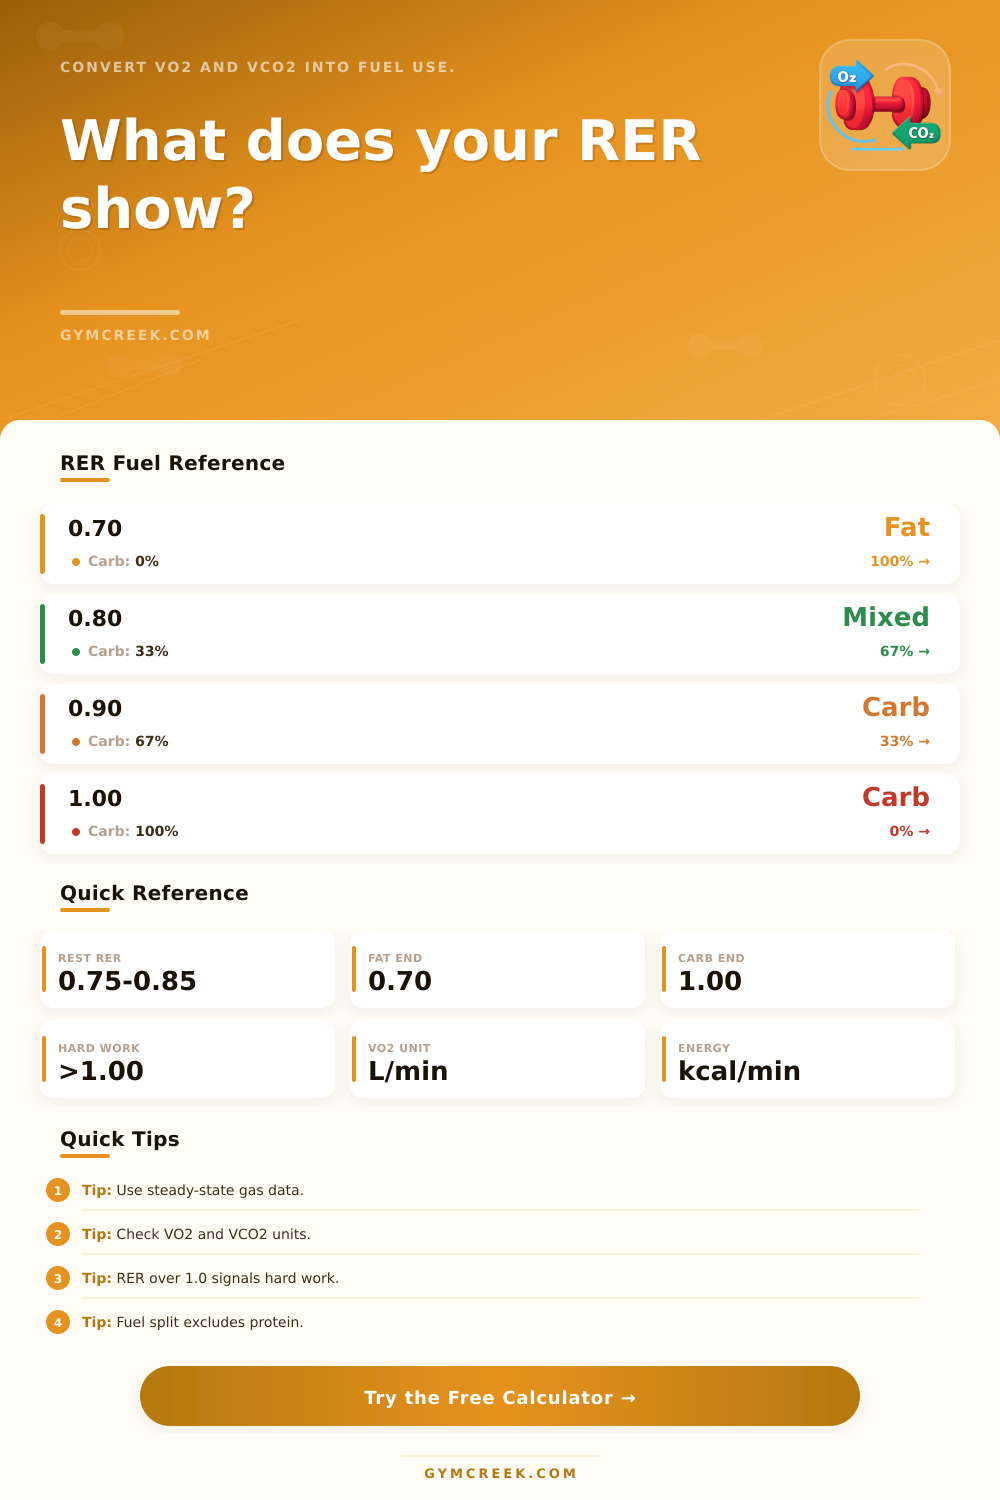
| 0.70 | Predominantly fat | 0% | 100% |
| 0.80 | Mixed, fat leaning | 33% | 67% |
| 0.85 | Balanced mix | 50% | 50% |
| 0.90 | Mixed, carb leaning | 67% | 33% |
| 1.00 | Predominantly carbohydrate | 100% | 0% |
| >1.00 | Heavy or non-steady work | High | Low |
| Input | Formula | Output | Use |
|---|---|---|---|
| VO2, VCO2 | VCO2 / VO2 | RER | Fuel signal |
| RER | 3.815 + 1.232 x RER | kcal/L O2 | Energy rate |
| VO2, weight | L/min x 1000 / kg | ml/kg/min | Fitness context |
| VO2, HR | VO2 x 1000 / bpm | O2 pulse | Stroke context |
| Scenario | Typical RER | Interpretation | Watch Point |
|---|---|---|---|
| Rested easy aerobic | 0.75-0.85 | Mixed fuel | Need steady data |
| Tempo endurance | 0.88-0.96 | Carb rising | Breathing drift |
| Threshold testing | 0.95-1.05 | High carb | Lactate support |
| Severe interval | >1.00 | CO2 buffering | Fuel split limited |
| Quality Check | Good Sign | Concern | Action |
|---|---|---|---|
| Stage length | 3-5 min steady | Rapid drift | Average late stage |
| RER range | 0.70-1.00 | <0.70 or >1.10 | Check data |
| Unit match | Same VO2/VCO2 unit | Mixed units | Convert first |
| Context | Known fed state | Unknown diet | Note limits |
💡Tips
After a lengthy workout, pull out your smartwatch and look at the calories burned. One number appear on the screen. That’s the energy you’ve expended. But what did you expend it with? There are two primary types of fuel in your body. If you know whether you’re running on fat or carbs, you’ll be able to make better choices about when to train and how much to eat.
This balance is measured by the respiratory exchange ratio. It tracks both the amount of carbon dioxide you breathe out as well as the amount of oxygen you take in during exercise. In other words, it converts gas exchange into easy-to-read fuel-use report card. Fortunately there’s a page where they did all the math for us here. It’s a calculator for the respiratory exchange ratio and what you have to do is put in your carbon dioxide output and your oxygen uptake which saves you from having to figure out your own metabolic coefficients.
How Your Body Uses Fat and Carbs for Energy
Here’s how it works. In terms of how your body works, you burn fuel (carbs or fat) creating energy and each one have a different chemical fingerprint. When fat burns, it uses more oxygen than amount of carbon dioxide it releases. Carbohydrates produce more CO2 for every liter of O2 used. What you end up with is a ratio based off what you’re burning.
Intensity makes a big difference in this ratio, something many athletes don’t realize. Your body wants fat (it’s abundant and requires less oxygen immediately) when at rest and doing light aerobic exercise. When pushing hard, carbs are the fuel of choice since they break down quickerer. It’s a gradual transition; no abrupt switch-over here.
If your ratio hovers around 0.7, you’re primarily burning fat. If it skews closer to 1.0, you’re relying more on carbohydrates. This explains why some workouts seem easier to maintain over a certain amount of time while others seem tougher, even if they both last the same amount of time.
But it’s also the data that matters. Because metabolic systems respond slowly to a change in effort, you need stable-state conditions to achieve an accurate reading. Any residual physiological noise from an increase in heart rate and/or breathing rate will skew the ratio different than actual fuel use. This chart shows typical ranges for various levels of activity, though factors like physiological noise or bicarbonate buffering can mean the ratio doesn’t always represent true fuel use alone (see page). Real-world testing results can vary beyond what occurs under controlled lab conditions.
The other frequent error occur with numbers greater than 1.0. Many people believe that this can’t happen, or is incorrect. What it typically signifies is that you’ve moved into a high-intensity zone and are starting to buffer lactic acid with bicarbonate. This creates excess carbon dioxide that wasn’t created through fuel oxidation but rather through buffering, which will raise the number artificialy. Knowing that keeps you from jumping to false conclusions about the amount of carbohydrate being used in your sprint or interval effort. It all depends on the effort you’re putting out and how that relates to what the number represents.
These numbers are very much influenced by your nutritional state as well. If you train depleted (i.e., glycogen depletion), or in a fasted state, it makes sense that this number would be lower since there’s less carbohydrates for the body to use up. On the other hand, if you eat a carb-heavy meal prior to your test, even if fit, this number may skew upwards. That’s why you shouldn’t look at two tests against each other, they’re too different. How much you ate before you went out matters, as does how hard you worked.
This isn’t something that you’ll be able to use effectively right away; it’s going to take time, consistency and a bit of patience. Don’t expect massive changes from one day to another. Instead, look at the bigger picture by tracking things across multiple weeks or even months. Your goal should of being to determine what your body’s default settings are, how those settings change based on varying levels of training stimulus and how you can adjust your pace and nutrition accordingly to achieve your desired performances.
The key is understanding which type of exercise uses which fuel source, so you can create a strategy for your nutrition and pacing based on that knowledge. With gas exchange metrics, you have a window into the metabolic efficiency that traditional heart rate monitors don’t show. This data shows you not only how hard you worked, but what type of fuel powered your efforts. You can use this information to fine tune your training program if you desire to burn more fat during your endurance workouts, or better use carbohydrates during your speed work. Your body is a complex engine; understanding which fuel line is open keeps it running efficienty.