Renaissance Periodization Macro Calculator
Build an unofficial RP-style macro phase from body stats, training demand, diet phase, and weekly trend feedback.
📌Presets
Presets load complete phase examples and calculate immediately. This tool is educational and is not affiliated with Renaissance Periodization.
⚙Calculator
RP-style macro phase
Enter your stats to estimate phase calories and macros.
📊Fitness Metrics
📑Reference Tables
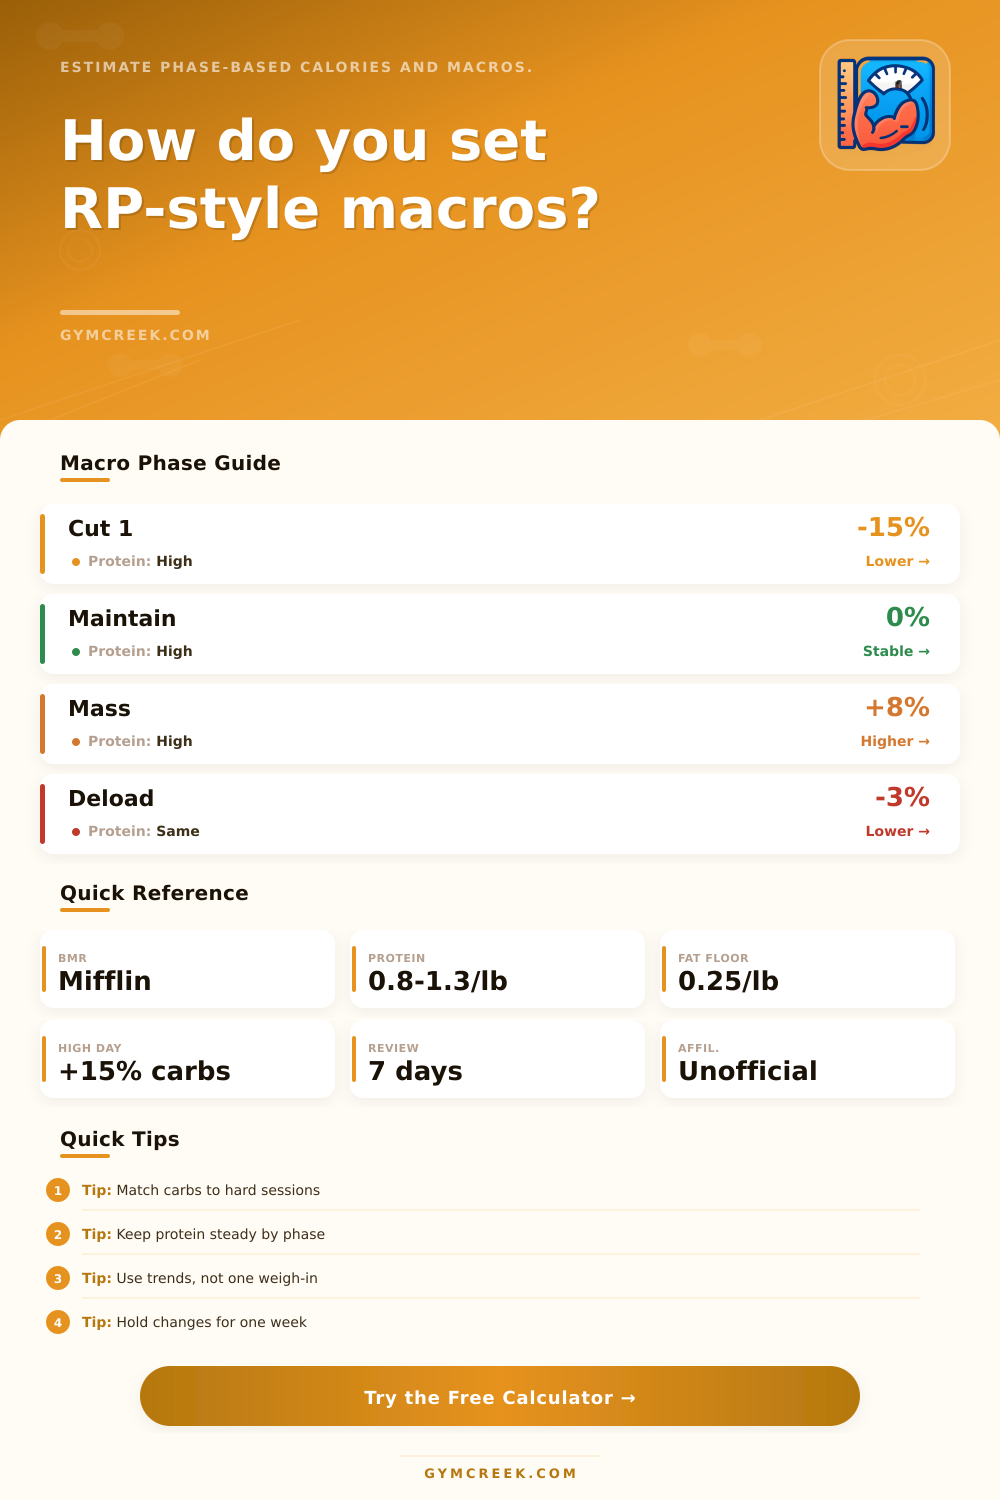
| Phase | Calorie bias | Protein cue | Weekly aim |
|---|---|---|---|
| Fat loss 1 | -15% | High | -0.5 to -1% |
| Fat loss 2 | -20% | Higher | -0.8 to -1% |
| Maintenance | 0% | Stable | Hold weight |
| Massing | +8% | High | +0.25 to +0.5% |
| Deload | -3% | Same | Recover |
| Day type | Calories | Carbs | Use case |
|---|---|---|---|
| High | Highest | Highest | Hard lift |
| Medium | Average | Average | Normal lift |
| Low | Lowest | Lowest | Rest day |
| Deload | Lower | Lower | Low volume |
| Trend | Cut action | Mass action | Note |
|---|---|---|---|
| On target | Hold | Hold | Repeat week |
| Too fast | Add cals | Trim cals | Control pace |
| Too slow | Trim cals | Add cals | Small move |
| Flat | Trim cals | Add cals | Check trend |
| Formula | Variables | Output | Use |
|---|---|---|---|
| Mifflin | W,H,A,S | BMR | Base need |
| TDEE | BMR x act | Calories | Maintenance |
| Phase bias | TDEE +/- % | Target | Diet phase |
| Macro split | P,F,C | Grams | Daily plan |
💡Tips
No matter how hard you work out and no matter what you eat, there are days where scale doesn’t change… Or it changes by only a few pounds. That’s because weight loss isn’t linear. Instead, it go up and down and stalls and recovers.
The Renaissance Periodization system acknowledges that fact. It include phased blocks to keep your metabolism honest. Of course, this happen while you move towards your target. It does all of the math for you. Enter your general numbers and it work out your real maintenance number.
How The Renaissance Periodization Plan Works
Most people guess at how much they burn incorrecty. They either underestimate how exercise changes their metabolism or overestimate how active they are. The calculator start with your base metabolic rate (resting metabolism) using the Mifflin-St Jeor formula. Then it adjust based off your training and movement stress. Even though two people might think they’re moving around a lot, one is getting a ton of extra calorie burn from running while the other is weightlifting and burning fewer calories. If you get starting point correct, you avoid failure early on.
Phase Adjustments, Your eating changes based off these phase adjustments. There’s no perpetually staying in a deficit for months. Instead, there are periods of massing, maintenance, and cut blocks as part of the cycle. Carbs vary based on your training load (see the reference table). On a heavy lifting day, you increase carbs so you can fuel your work. On a rest day, you reduce carbs because your body doesn’t require the energy. Cycling like this stabilize blood sugar. It also avoids the tiredness that comes with strict calorie restriction.
There’s one input where you feed back whether the trend is “too fast,” “too slow,” “flat” or “on target.” It requires that you look at data rather than feelings. When you lose two pounds during a week, it’s probably water. Maintain the same deficit and you risk losing muscle mass. That will cause the tool to dial back ever so slightly until you’re maintaining pace again. If you’ve been good but aren’t moving the scale, you’ll need to increase calories to get out of the rut. Over time, you learn to read the trend, not the day-to-day noise.
The phase you are in make a difference because your protein needs vary depending on that phase. If you’re in a deep cut phase, it’s all about saving your lean tissue. You should of increase your protein intake in grams per pound of body weight. When you’re massing, it’s all about giving yourself energy for growth while avoiding fat storage. The calculator handle that for you. It takes into account phase selection and body fat percentage. There are no coefficients to memorize. Carbs & fats swing the energy balance, but protein is the anchor for keeping muscle retained.
One variable here is adherence. Life occurs. Recognizing this by entering a realistic adherence percentage means you’re not throwing away your gains because of one skipped workout or missed meal. As long as your overall adherence for the week remain consistent, it doesn’t matter. When following the plan decreases, the tool softens its corrections to avoid overcorrection and yo-yo dieting. That’s what makes these tools realistic: They separate plans that are sustainable from those that is rigid. Rigid plans tend to burn people out within weeks.
Why? This approach view your body as an adaptive system. It is not just some kind of calorie counter. The way you recover determine the results. The stress you put on it affect your recovery. By cycling both nutrition and intensity, you prevent metabolism from slowing down. You increase intake on training days. Deload correctly to allow proper recovery. Adjust with evidence, not hope.
Sometimes the scale lie. Staying on track means letting the numbers guide your next move instead of your mood. That is the patience needed between a temporary fix and a permanent change to how you fuel your life.