Race Time Calculator Predictor
Project your next finish time by converting a recent race into a road-equivalent effort, then applying distance-based pace decay, terrain drag, and climb load across common race jumps.
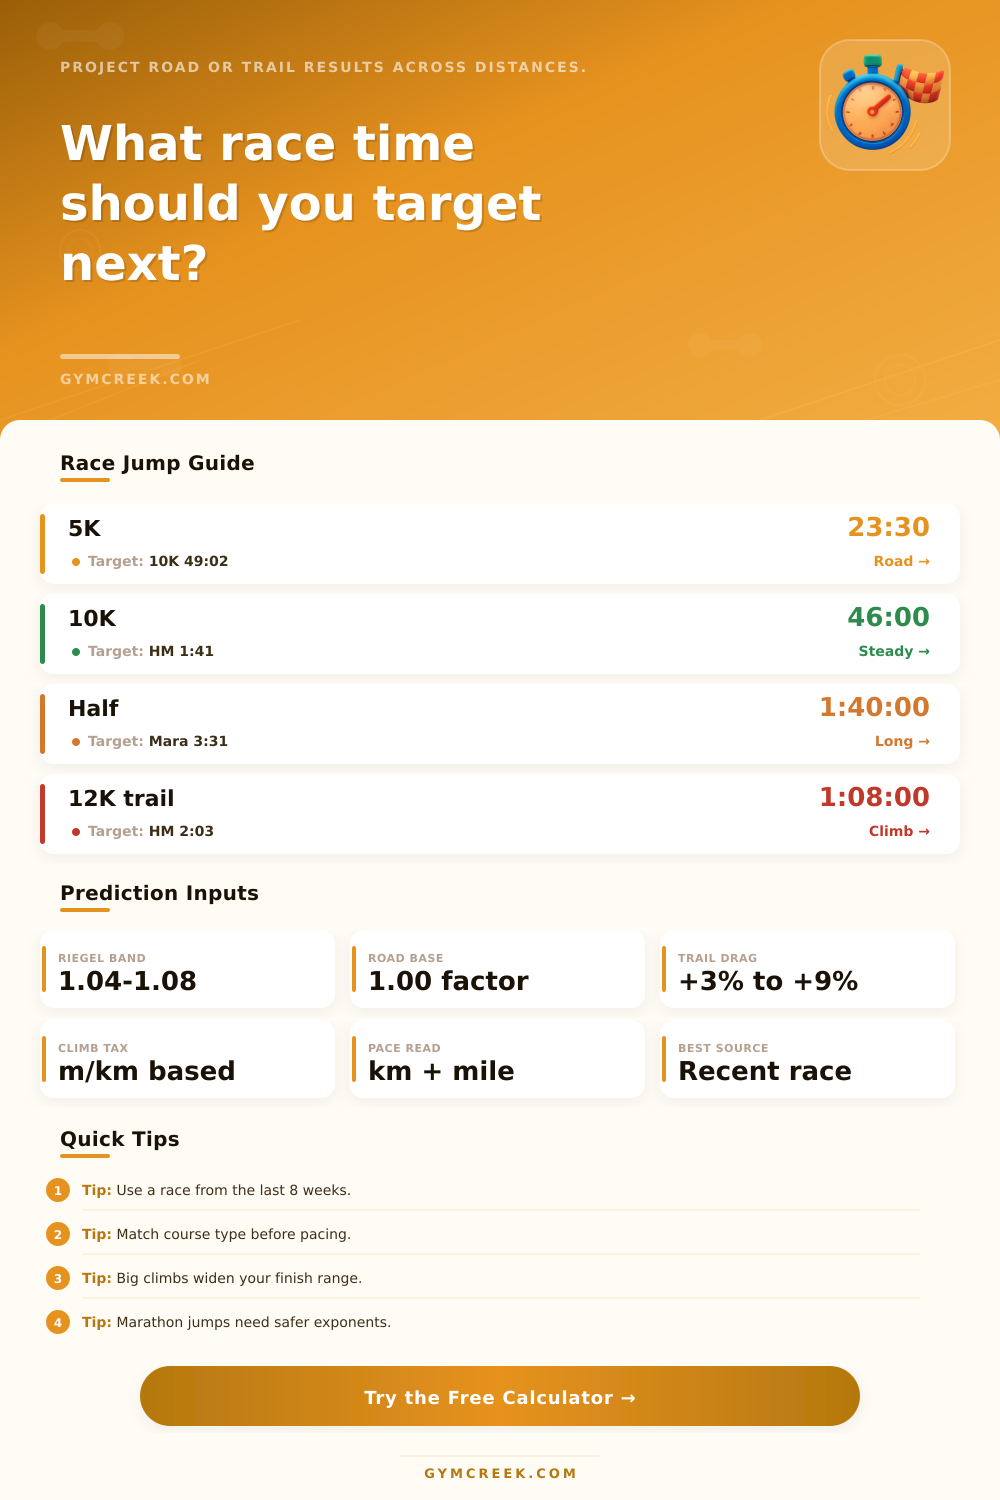
📌Preset Race Scenarios
Each preset loads a realistic source race, target distance, fatigue curve, and course pairing so you can sanity-check short road jumps, long marathon projections, and slower trail conversions without retyping every field.
⚙Prediction Inputs
Target finish estimate
Load a preset or enter a recent race to see an adjusted target prediction.
📊Race Metrics Grid
📑Reference Tables
| Race | Kilometers | Miles | Typical Use |
|---|---|---|---|
| 1500m | 1.5 km | 0.93 mi | Track speed and turnover |
| 5K | 5.0 km | 3.11 mi | Best short-road benchmark |
| 10K | 10.0 km | 6.21 mi | Strong aerobic predictor |
| Half marathon | 21.0975 km | 13.11 mi | Useful marathon bridge race |
| Marathon | 42.195 km | 26.22 mi | Long-end endurance test |
| Course | Factor | Effect | Best Match |
|---|---|---|---|
| Track | 0.99 | Slightly faster than neutral road | Measured loops and lane work |
| Flat road | 1.00 | Neutral baseline | Certified road courses |
| Rolling road | 1.02 | Small slowdown from rhythm breaks | Bridgey or undulating routes |
| Crushed gravel | 1.03 | Minor surface loss | Packed parkway racing |
| Light trail | 1.05 | Moderate drag from footing | Runnable dirt loops |
| Technical trail | 1.09 | Large slowdown from terrain variance | Rocky or rooty racing |
| Profile | Exponent | Runner Type | Use It When |
|---|---|---|---|
| Speed-leaning | 1.04 | Sharp 3K to 10K racer | You hold pace well over short jumps |
| Classic road | 1.06 | Typical road runner | You want a balanced Riegel-style forecast |
| Endurance-deep | 1.05 | High-mileage durable racer | Long efforts fade less than average |
| Conservative jump | 1.08 | Uncertain long-distance leap | You are moving far beyond your proven race length |
| Gain per km | Course Feel | Added Time | Pacing Note |
|---|---|---|---|
| 0-5 m/km | Mostly flat | 0% to 1% | Normal pacing plan works |
| 6-10 m/km | Rolling | 1% to 3% | Expect small split drift |
| 11-20 m/km | Hilly | 3% to 5% | Use effort over pace |
| 21-30 m/km | Climb-heavy | 5% to 8% | Open conservatively |
| 31+ m/km | Mountain feel | 8%+ | Range matters more than a single finish time |
💡Prediction Tips
Feed the calculator with a recent all-out race on similar footing. A soft-trail 10K converted into a flat-road half can be useful, but the confidence band should stay wider than a same-surface road jump.
For marathon and ultra jumps, use the conservative profile unless long workouts already prove durability. Equivalent time formulas are strongest when fueling, pacing, weather, and terrain are close to the target race.
To predict race times, individuals use data to calculate the time that an individual will take to complete future race. Many individuals use the results of the races that they have recently competed in to try to determine their results for future races. They use this data to determine their fitness level.
Their mathematical tool can calculate these predictions by taking into account different variables of the race. The first variable of the mathematical equation is the equivalence of the different races. The equivalence calculation requires an individual to compare the results of one race to another race that they hope to compete in the future.
How to Predict Your Race Time
For instance, if an individual has recently completed a 10K road race, their result is a measurement of their performance on the road. However, if they want to predict the result that they will recieve for a trail race, they must normalize the result that they received from the trail race. They must do this to account for the difference in terrain between the two type of races.
The terrain can slow the individual down. The second variable is the decay curve. Individual use this decay curve to calculate the difference between the performance that they can exhibit for short distances compared to the performance that they could exhibit for long distances on the track.
This is because performance for short distances utilizes anaerobic energy but for long distances, the body utilizes aerobic energy. Thus, the decay curve accounts for this difference in energy usage between short and long distance. An individual must select the correct decay profile to account for their strengths as a runner.
For instance, some runners exhibit their best performance for short distances, thus they will have a steep decay curve. Other runners will have a much flatter decay curve because they can exhibit their best performance for long distances. An individual can also select a conservative decay profile to ensure that they dont run too ambitiously goals for their future races.
Terrain and elevation will change the time that an individual takes to complete a race. For instance, roads are different than trails because trails require individuals to constantly change directions to avoid obstacles like rocks and roots. Thus, if the trail is considered technical, it will take an individual more time to complete the trail than if they were to race on a road.
Additionally, if there is an elevation gain for the race, it will make taking part in the race take more time from the individual. The density of the elevation gain for the race will make a biggerer difference in how long it will take an individual to complete the race than a lower elevation gain. For these reasons, individuals can calculate the terrain delta and the climb tax to add to the time that an individual will take to complete a race based off these variables.
An individual must avoid a few mistakes when attempting to use these prediction tools. For instance, one mistake is to use a training run to try to determine the time that an individual will take to complete a race. Training runs may be easy for an individual but that doesnt provide an accurate measurement of the maximum fitness level that an individual possesses.
Instead, individuals should use the result that they achieve when completing an all-out race within the last eight weeks. Another mistake is to ignore the differences between course types. When an individual uses the result from a trail race to calculate a road race, they may end up with an inaccurate prediction.
Large jumps in distance can also result in inaccuracies in the time that is predicted; thus, they should be cautious when making these types of predictions. The race time that is calculated provides a range of times. This is because there are a variety of other factors that may influence the individual’s performances during the race.
For instance, an individual may have a great mathematical calculation for their race times, but factors outside the body such as weather, sleep, and nutritional intake may impact an individual’s performance in the race. Thus, while the mathematical calculation is a great start for individuals to understand how long it may take for them to complete a race, these other factors also need to be considered. For races that are longer than 50K, the decay curve will be steeper and the terrain will be more important in determining the individual’s times for the race.
To calculate the times that an individual will take for their races, they can use their recent race results. By normalizing their results for terrain, using a decay curve to determine the difference in performance for short distances compared to long distances, and also taking into account the differences in elevation for the race, they can have a betterer idea of the time that they will take to complete these races. Furthermore, they should use all-out race results for the best prediction of their times for the future rather than training runs.
They should also respect the range of times that is provided to ensure that they also consider the other factors that may impact their races. These steps would of helped individuals to have a betterer idea of the goal that they can achieve for their future races.