Power Walking Calorie Calculator
Estimate power walking calories from body size, speed, duration, grade, surface, arm drive, cadence, carried load, intervals, weekly frequency, and goal context.
📌Power Walking Presets
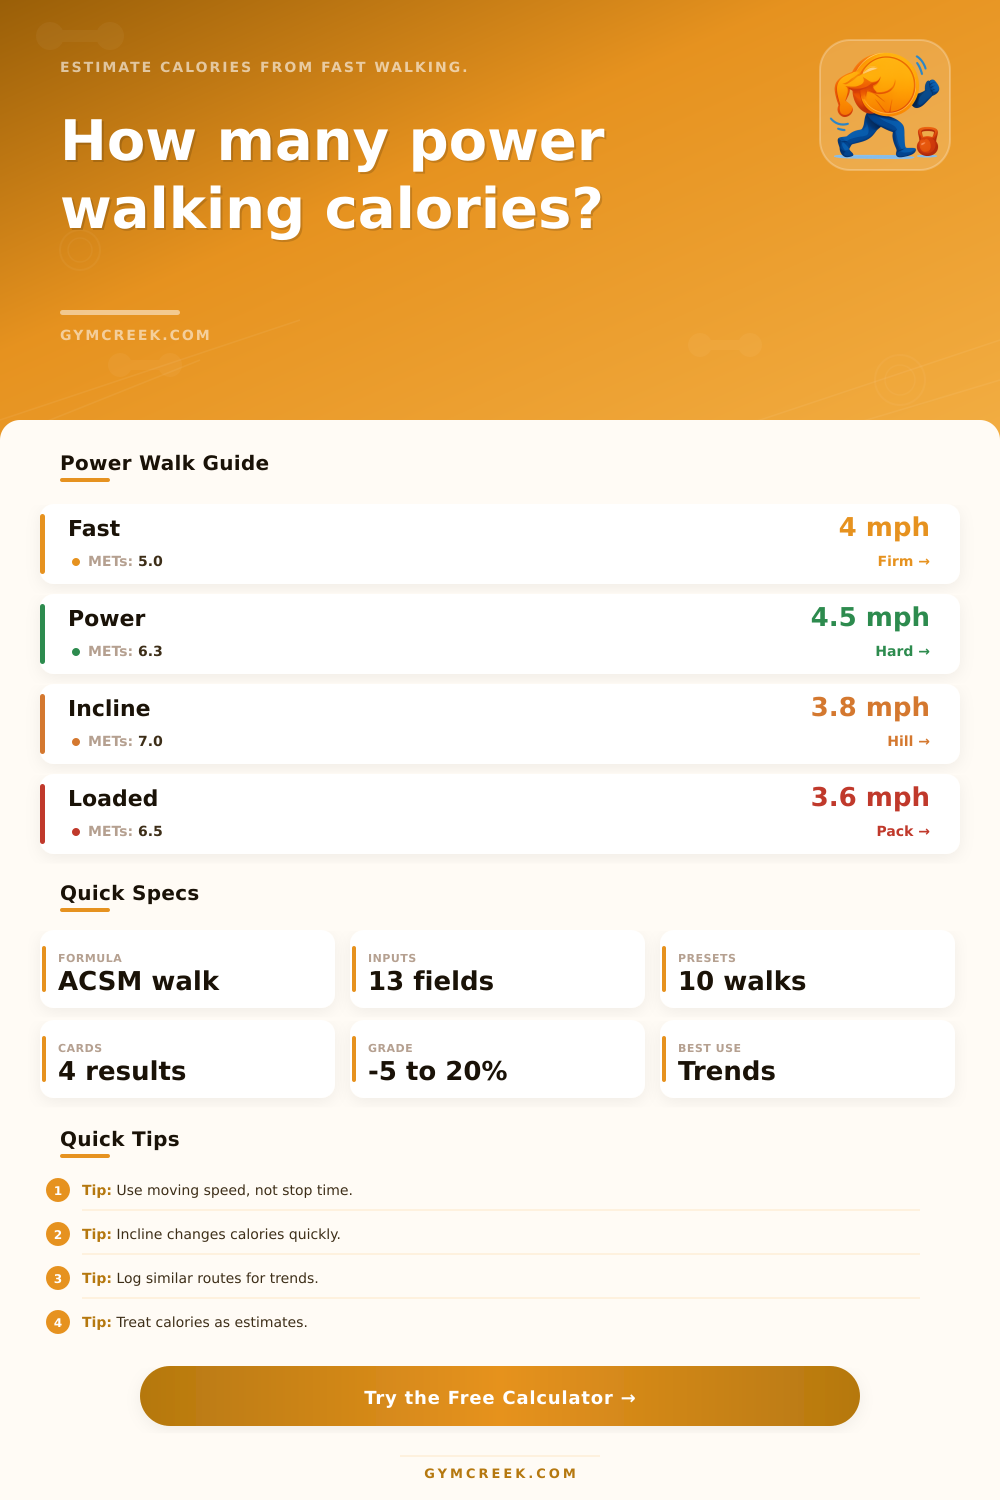
The main estimate uses the ACSM walking equation, then adjusts for power-walking arm drive, cadence realism, surface, carried load, and interval work.
⚙Power Walking Inputs
Power walking calorie snapshot
Enter body size, speed, grade, surface, cadence, load, and frequency to estimate session calories.
📊Power Walk Metrics
📑Reference Tables
| Band | Speed | Typical MET | Practical cue |
|---|---|---|---|
| Brisk walk | 3.2-3.9 mph | 3.8-4.8 | Purposeful, talkable |
| Power walk | 4.0-4.5 mph | 5.0-6.3 | Quick arms, firm breathing |
| Fast power walk | 4.6-5.0 mph | 6.4-7.2 | Athletic walk effort |
| Incline power walk | 3.2-4.2 mph | 6.0-9.0 | Hill cost dominates |
| Factor | Low Cost | Higher Cost | Calculator use |
|---|---|---|---|
| Surface | Track or road | Grass, sand, hills | Applies economy multiplier |
| Grade | 0-2% flat | 6%+ incline | ACSM vertical term |
| Carried load | 0-5% body wt | 10%+ body wt | Adds effective mass |
| Intervals | 0-10% | 30%+ | Raises adjusted VO2 |
| Scenario | Duration | Speed | Planning note |
|---|---|---|---|
| Lunch walk | 25-40 min | 3.8-4.4 mph | Keep stops separate |
| Treadmill incline | 30-50 min | 3.0-4.0 mph | Incline drives METs |
| Long base walk | 60-120 min | 3.3-4.0 mph | Lower grade, steady fuel |
| Power intervals | 25-45 min | 4.0-5.0 mph | Use percent intervals |
| Output | Formula | Inputs | Why it matters |
|---|---|---|---|
| VO2 cost | ACSM walking | Speed, grade | Core energy estimate |
| Calories | VO2 x kg x time | Mass, minutes | Session burn |
| Steps | Cadence x time | Steps/min | Volume context |
| BMR context | Mifflin-St Jeor | Sex, age, size | Daily comparison |
💡Power Walking Tips
Somewhere in between running and simply taking an afternoon stroll is power walking. It’s somewhere in the middle, which means the number of calories you burn shift depending on terrain and your speed.
You might assume your phone app or watch has it all covered. Probably not. Those apps use broad averages. They ignore things like carrying a backpack, what surface you’re on and how hard you push with your arms. The kicker is if you log the exact same power walk multiple times. Even though you’re moving at about the same speed, you’ll see the numbers fluctuate.
Why Your Calorie Count Changes
The first place to begin calculating is the obvious one: Speed. You burn fewer calories running at 3.5 miles an hour then at 4.5 miles an hour over the same distance. Beyond that, difference isn’t just a straight line; as you move beyond roughly 4 miles per hour, technique and vertical effort plays a bigger role. Tossing in even a small incline will multiply cost much quicker than most realize. A brief hill can outweigh a longer flat section.
The calculator (above) do all of this math for you after you input speed, weight, grade and surface type. That’ll save you from doing any conversions or guessing at coefficients.
Most people forget about surface. Ground gives underfoot and forces small changes in your stride. This means grass, sand, and gravel all require more (or less) work than walking at the same speed on hard surfaces. A dirt road is similar to a paved one, but firm sand will make an extra dent in your energy level. Rather than having you memorize multiple table, the tool converts this into basic multipliers.
Similarly, carrying a load works the same way: Even a lightweight daypack adds enough weight to your body to raise overall caloric expenditure without impacting your speed. Next, there’s the issue of cadence (steps per minute) and arm swing. A vigorous arm drive, for instance, is a lot of extra work… And would of been absent from more relaxed, casual walks. Shorter strides with faster steps also tend to come with higher energy costs. To make it all reflect your actual walking, not some idealized version, you can tweak both elements with the inputs.
Raising average intensity for part of the workout, as intervals do, is similar: You don’t have to monitor every second, just recognize that 15% or 20% of the time felt tougher. That is enough for calculator to adjust everything. It’s when you think in terms of trends versus a single session that the weekly frequency becomes important. Two long walks don’t equal four good ones. Your output displays the weekly view to compare different schedule and also shows the session total.
To put it another way: the tables on the page group common speeds into intensity bands and show the stacking of modifiers due to load and terrain. They’re meant for quick checks, not precise planning. More than any specific number, there’s one useful thing to do: log a route a few times, entering the same info each time and observing that little tweaks in the surface, grade, or your load affect the calorie calculation. More helpful than seeking an accurate count on any particular day would be seeing that pattern.
Making those comparisons is what the tool does for you, it keeps equation stable while you experiment with different real-world factors. Actually, more people finds this useful.