Pedal Stroke Efficiency Calculator
Score cycling pedal stroke quality from torque effectiveness, pedal smoothness, left-right balance, cadence, power, crank length, ride duration, and rider context.
📌Presets
Presets load realistic cycling scenarios and calculate stroke score, useful crank power, dead-spot loss, balance bias, cadence match, and energy context.
⚙Calculator
Pedal stroke efficiency snapshot
Enter power-meter metrics to estimate useful crank power, dead-spot loss, cadence match, and balance quality.
📊Fitness Metrics Comparison Grid
📑Reference Tables
| Power-Meter Metric | Developing Range | Solid Range | High-End Range |
|---|---|---|---|
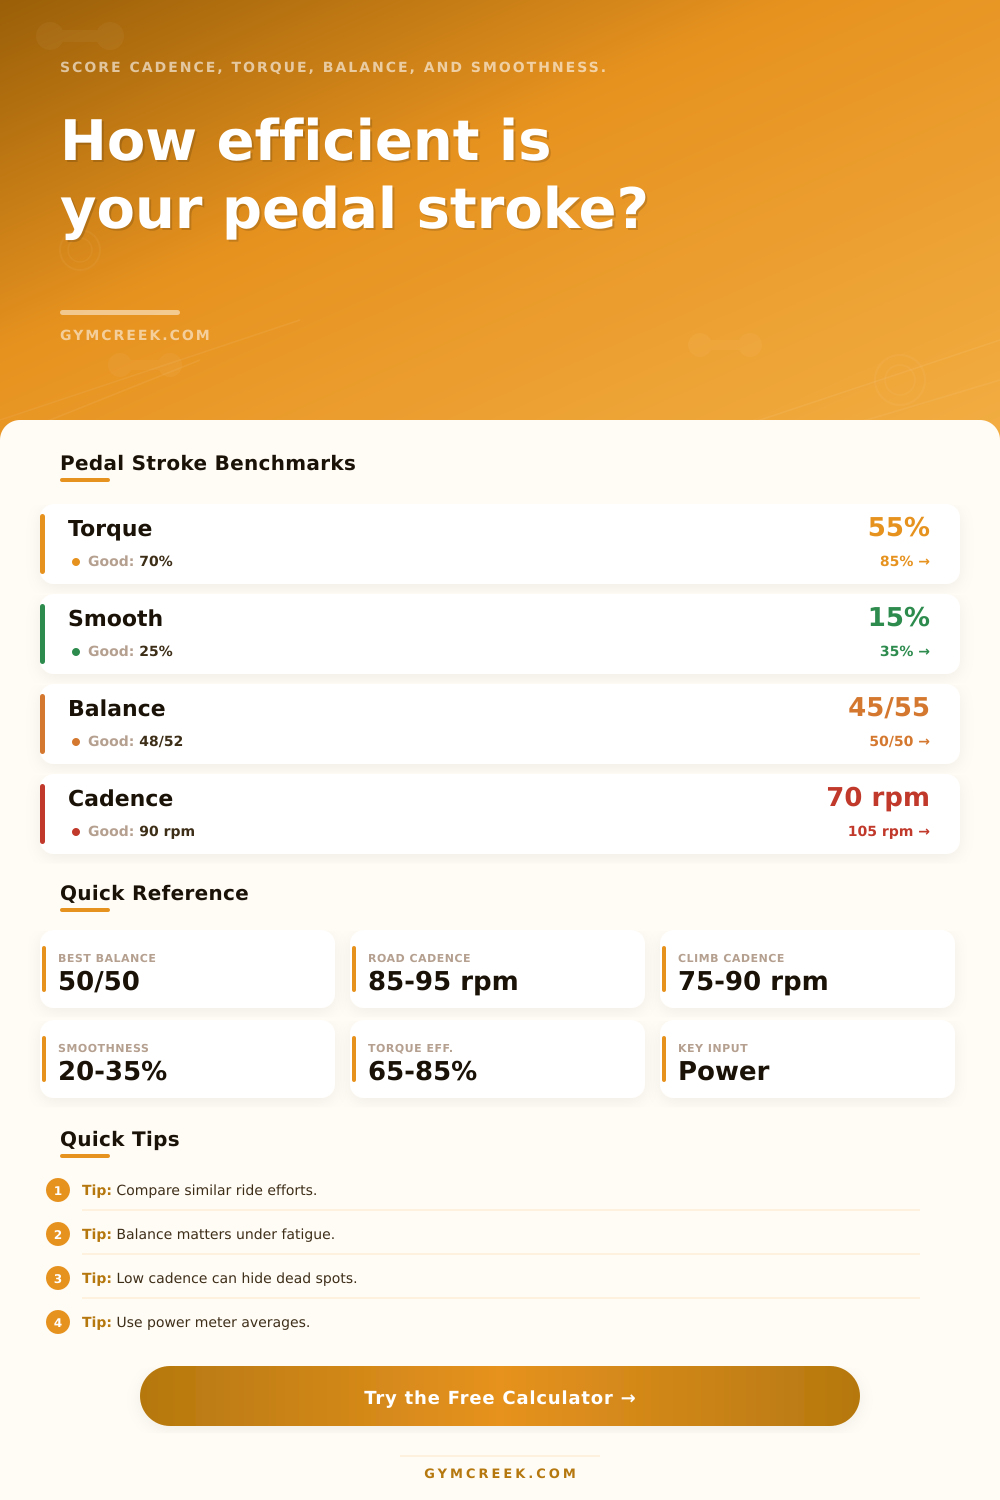
| Torque effectiveness | 55-65% | 66-78% | 79-90% |
| Pedal smoothness | 12-20% | 21-32% | 33-45% |
| Left-right balance | 44/56 to 46/54 | 47/53 to 48/52 | 49/51 to 50/50 |
| Cadence match | 15+ rpm away | 6-14 rpm away | 0-5 rpm away |
| Seated stability | Below 70% | 70-90% | 90%+ when appropriate |
| Cycling Focus | Typical Cadence | Technique Priority | Watch For |
|---|---|---|---|
| Endurance road | 85-95 rpm | Repeatable smoothness | Late-ride drift |
| Tempo riding | 88-98 rpm | Stable torque under load | Balance shift |
| Seated climbing | 75-90 rpm | Constant pressure phase | Low cadence mashing |
| Time trial or tri | 88-100 rpm | Aero-position consistency | Hip angle limits |
| Sprint or track | 105-130 rpm | Fast force application | Ragged smoothness |
| Rehab spin | 75-90 rpm | Symmetry first | Protected-side drop |
| Scenario | Expected Pattern | Result Meaning | Next Check |
|---|---|---|---|
| Fresh endurance ride | Balanced, steady cadence | Clean baseline | Repeat monthly |
| Hard climb | Higher torque, lower rpm | Efficiency may dip | Compare same grade |
| Fatigued tempo | Balance drifts late | Form under load | Split first vs last half |
| Indoor technique drill | High smoothness focus | Useful for practice | Hold same watts |
| Bike fit concern | Repeated one-side bias | May need fit review | Check cleat and saddle |
| Formula | Variables | Output | Use |
|---|---|---|---|
| Angular velocity | 2 × pi × rpm / 60 | rad/s | Crank speed |
| Average torque | Power / angular velocity | N·m | Crank torque |
| Dead-spot loss | Power × (1 - TE) | Watts | Torque gaps |
| Useful power | Power × TE × balance × cadence | Watts | Stroke output |
| Stroke score | Weighted TE, PS, balance, rpm, seated | 0-100 | Technique grade |
| Energy cost | Watts × time / 23% | kcal | Ride context |
💡Tips
You spin around a corner up a hill and suddenly there’s something wrong. There is a hitch on the right side again. But this time you know what it is: It isn’t pain. It’s just inefficiently. Your legs is working hard, but not all of their force gets translated through the chainring.
That’s where most cyclist stall out. Their eyes glaze over when they look at their power numbers. But their gaze skips past the mechanical story behind those numbers. We tend to think of cycling as pure output. It’s more like this: It’s about how clean you can be in converting muscle into motion.
How to Improve Your Pedal Stroke
And pedal smoothness and torque effectiveness is often the two metrics that tell the difference between a smooth-riding day and a ragged one. They’re two measures of how much of our efforts turn the wheel rather than bounce off it. Pedal smoothness mean how evenly you apply pressure from peak to trough. You may have great pedal smoothness, but if you’re dragging your foot on the upstroke you are fighting your own momentum through poor torque effectiveness.
To be effective with torque, are you applying force throughout the full circle? You might have a very uneven stroke but still has high torque. That’s particularly true when climbing in a low gear. So the point of all this is that no single number tell you what you want to know. You want to know how these numbers interact under load.
To do that we created the tool above which will calculate that interaction for you, weighing your unique rhythm and balance against realistic benchmarks different than generic averages. It takes out the noise so you can see where your form is falling apart or holding up.
There’s also a lot of hidden drag from left-right balance. Even pros is slightly out of whack. That said, if it’s persistently off-kilter, then odds are good that it’s either a matter of strength asymmetry or poor bike fit. For example, say your right leg is doing fifty-five percent of the work and your left is coasting with forty-five, now you’re wasting energy on your stronger side, but more importantly, you’re risking overuse injury there.
These figures can be put into context using the reference tables on the page. Different types of riding style call for a different kind of smoothness profile (a standing hill climb is not the same as a time trial). And finally, don’t judge a sprinter form by endurance standards.
Lots of cyclists gets obsessed about cadence. It is as though it’s some magic number where every rider should operate. It isn’t. Optimal cadence changes by position, terrain, and tiredness. Yet operating in a self-imposed range; based off your effort level (promotes mechanical efficiency). Torque may appear large when you’re mashing a big gear while turning the cranks at sixty revs-per-minute. But your smoothness plummets. The muscular load spikes too steeply. Switching to a higher cadence reduces that peak force. Your stroke becomes rounder and easier to manage. It’s a balance between cadence and raw force.
But that’s all changing once you get fatigued. When you’re tired, the natural tendency for your balance shift towards your dominant side. Form tends to break down, and with that comes a loss of smoothness. That’s where comparing rides becomes more important then shooting for that perfect score on one interval. You don’t really care how efficient you are during one interval unless you can replicate that over an hour in the saddle. You also care about whether it falls apart when put under pressure.
The beauty of the calculator is that you can input intensity factors and duration of your ride. This paints a better picture of how you perform when under real world stress. It takes what would of otherwise been a bunch of numbers and makes it into a story: A story of just how durable you might be.
All in all, bettering your pedal stroke is not so much about creating the perfect circle as it is plugging holes in the energy transfer. Every slight increase in smoothness and balance are cumulative over distance. You may feel a 2% gain on a 10 minute ride isn’t noticeable. But when you multiply that by hours over days and weeks in an Ironman or a long tour, those watts make a big difference. Remember the ideal is not perfect, but consistent.
Practice maintaining equal power output while doing drills. If you adjust position, cadence AND power, then what you measure will be nothing but a bunch of noise. Change one variable at a time. Make sure to isolate the variables. Spin until you no longer feel that hitch in your stroke as a snag, but rather as a smooth loop. Then you’ll know you’re finally riding with the bike and not just against it.