Peak Height Velocity Calculator
Estimate maturity offset, predicted age at peak height velocity, current growth phase, and a training-load watch score for youth athletes.
📌Presets
Presets use plausible youth sport profiles and run the calculation immediately.
⚙Calculator
PHV maturity snapshot
Enter current measurements to estimate growth phase.
📊Metrics Comparison Grid
📑Reference Tables
| Maturity offset | Phase | Typical coaching use | Watch point |
|---|---|---|---|
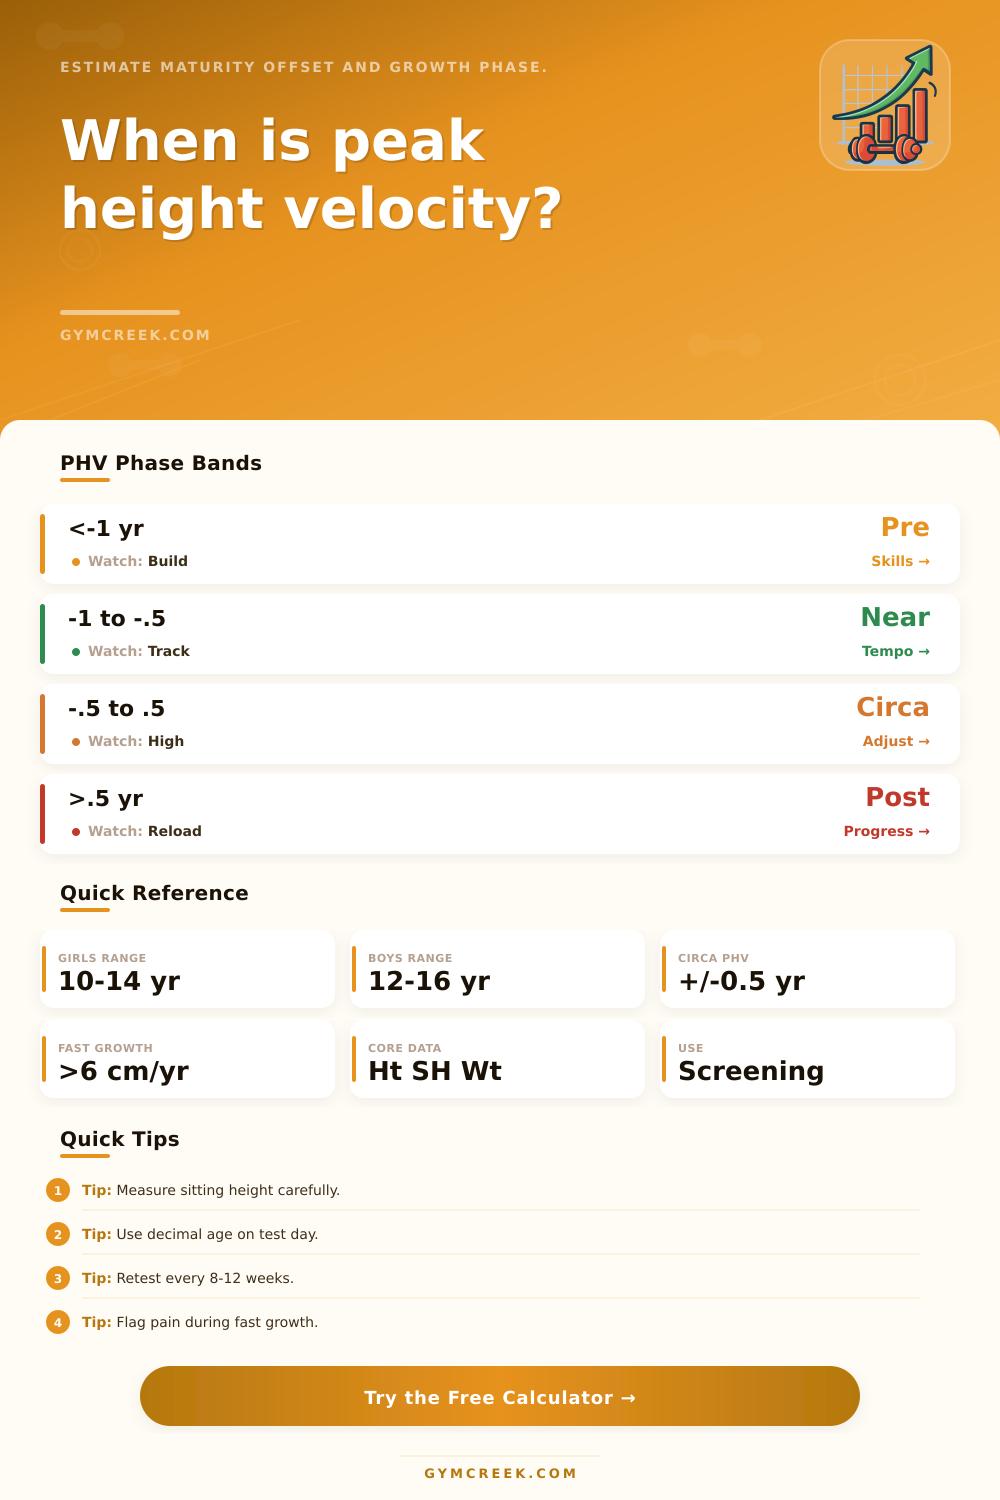
| Less than -1.0 yr | Pre-PHV | Skill, coordination, broad movement | Track growth trend |
| -1.0 to -0.5 yr | Approaching PHV | Prepare for rapid changes | Retest often |
| -0.5 to +0.5 yr | Circa-PHV | Adjust load and recovery | Highest monitoring |
| More than +0.5 yr | Post-PHV | Reload progressively | Rebuild tolerance |
| Measurement | Best practice | Common error | Effect |
|---|---|---|---|
| Decimal age | Age on test date | Rounded school age | Shifts offset |
| Standing height | Barefoot stadiometer | Shoes or hair volume | Inflates stature |
| Sitting height | Flat box, tall trunk | Slumping or tilted head | Biases leg length |
| Body mass | Same scale, same week | Old roster weight | Changes ratio |
| Load flag | Growth context | Training cue | Retest rhythm |
|---|---|---|---|
| Low | Slow growth, far from PHV | Normal progression | 12-16 weeks |
| Moderate | Near PHV or rising growth | Watch soreness | 8-12 weeks |
| High | Circa-PHV with fast growth | Reduce spikes | 4-8 weeks |
| Very high | Pain, overuse, high impact | Review load now | 2-4 weeks |
| Formula item | Variable | Unit | Role |
|---|---|---|---|
| Mirwald male | Age, LL, SH, W/H | cm, kg | Offset years |
| Mirwald female | Age, LL, SH, W, W/H | cm, kg | Offset years |
| Age at PHV | Age - offset | years | Estimated timing |
| Phase band | Offset range | years | Training context |
💡Tips
If your teen athlete appears to be getting more clumsy overnight, don’t assume they’re getting less skilled; they probably aren’t; it’s just that they’ve grown up. Their long bones grows ahead of their muscle adaptation. That mismatch makes them vulnerable. And coaches may misinterpret that as a failure of focus or desire.
Knowing where your athletes is on the growth curve changes how you approach their workload. And with the measurements plugged in, the calculator does the math for you, so you won’t waste time guessing if those stumbling fumbles are due to overtraining or normal development.
Why Teens Get Clumsy When They Grow
Peak height velocity is the point at which linear growth occurs fastest. Girls usually enter this stage around 10-14 years old; boys usually hit it around 12-16. Because it depends largely on both environment and genetics, the exact timeframe isn’t important; for training purposes, what matters is where the athlete is in relation to this spike. That is, someone who’s months from his or her greatest growth leap will react to intensity very differently then an athlete whose linear growth is complete.
This is called maturity offset measure and gives you a number of years left to go (or behind them) before or after peak. Obviously, how accurate these results are will depend completely on accuracy of your input variables, such as your sitting height. Any mistake in measuring your bodys torso may throw your predicted maturity stage off by months or more.
For example, a kid who seems to be pre-peak may have been measured while they were mid-sprint and their posture was slumped down. To avoid slouching while being measured, use a flat box against the wall to hold your trunk up straight. Also, always stand barefoot while being measured, with your head perfectly level. Any shoes will increase your height throwing off the leg-to-torso ratio that is central to the equation.
The output provides you with a phase classification once you have the numbers, and if they’re pre-peak athletes then they can do coordination drills and broad movement skills, they haven’t reached a point where they’re ready for maximum load, but their body is stable enough to handle technical work. As the offset nears zero, the risk profile shifts. You want to back off when it’s uncomfortabley rather than push through it. This happens during the peak window of growth-related soreness as bones rapidly lengthen and tendons stretches to keep up. Common complaints include knee issues and heel pain; time to smooth out your training intensity.
The load watch score combines reported symptoms and growth phase. It flags possible problems if the load watch score is high. That doesn’t mean halt everything, simply reduce large increases in impact or volume. Young athletes are resilient but fragile in the midst of rapid structure change. Chronic overuse injuries occurs when an athlete ignores the signal that something isn’t right and continues on. The athlete’s feedback around soreness matters just as much as these physical measurements.
The reason is that growth speed isn’t static. A kid who was stable in September could surge by November, which means you should of continue to test every eight to 12 weeks to maintain the current data. The page’s reference tables makes this pretty clear by matching distinct phases with coaching cues. However, the true power lies in linking those cues to your day-to-day training decisions.
For example, is there rapid growth? Does an athlete report recurrent pain? Math will flag it as high priority and you’ll adjust the load. Those numbers should be seen as screening tools that show areas to focus on; they are not a diagnosis. The best practice is to manage this data proactively so you can anticipate growth spurts. This helps you get the athlete ready both physically and mentally for what is coming.
The true benefit of monitoring the maturity offset is being able to build up your tolerance before the storm arrives, you take what’s typically a chaotic time in development and put it onto a schedule that makes sense. The bottom line is that peak height velocity is only part of the equation, and psychological stress, sleep, and nutrition also influence the development of an athlete. While growth mechanics don’t always get mentioned until there’s a problem, being aware of your child’s torso proportions and sitting height can give you some idea where things are headed. The clumsy teen isn’t broken; it just means they’re outgrowing their coordination during a growth spurt. Understanding the difference helps you encourage them during this awkward time instead of against it.