Oxygen Pulse Calculator
Estimate oxygen used per heartbeat from VO2 and exercise heart rate, then compare it with indexed delivery, heart-rate reserve, and test-protocol benchmarks.
📌Presets
Presets pair a realistic VO2 value with a matching heart rate so the oxygen pulse signal stays physiologically consistent.
⚙Calculator
Oxygen pulse snapshot
Enter VO2 and heart rate values from the same exercise stage.
📊Metrics Grid
📑Reference Tables
| Profile | O2 Pulse | Indexed | Training Read |
|---|---|---|---|
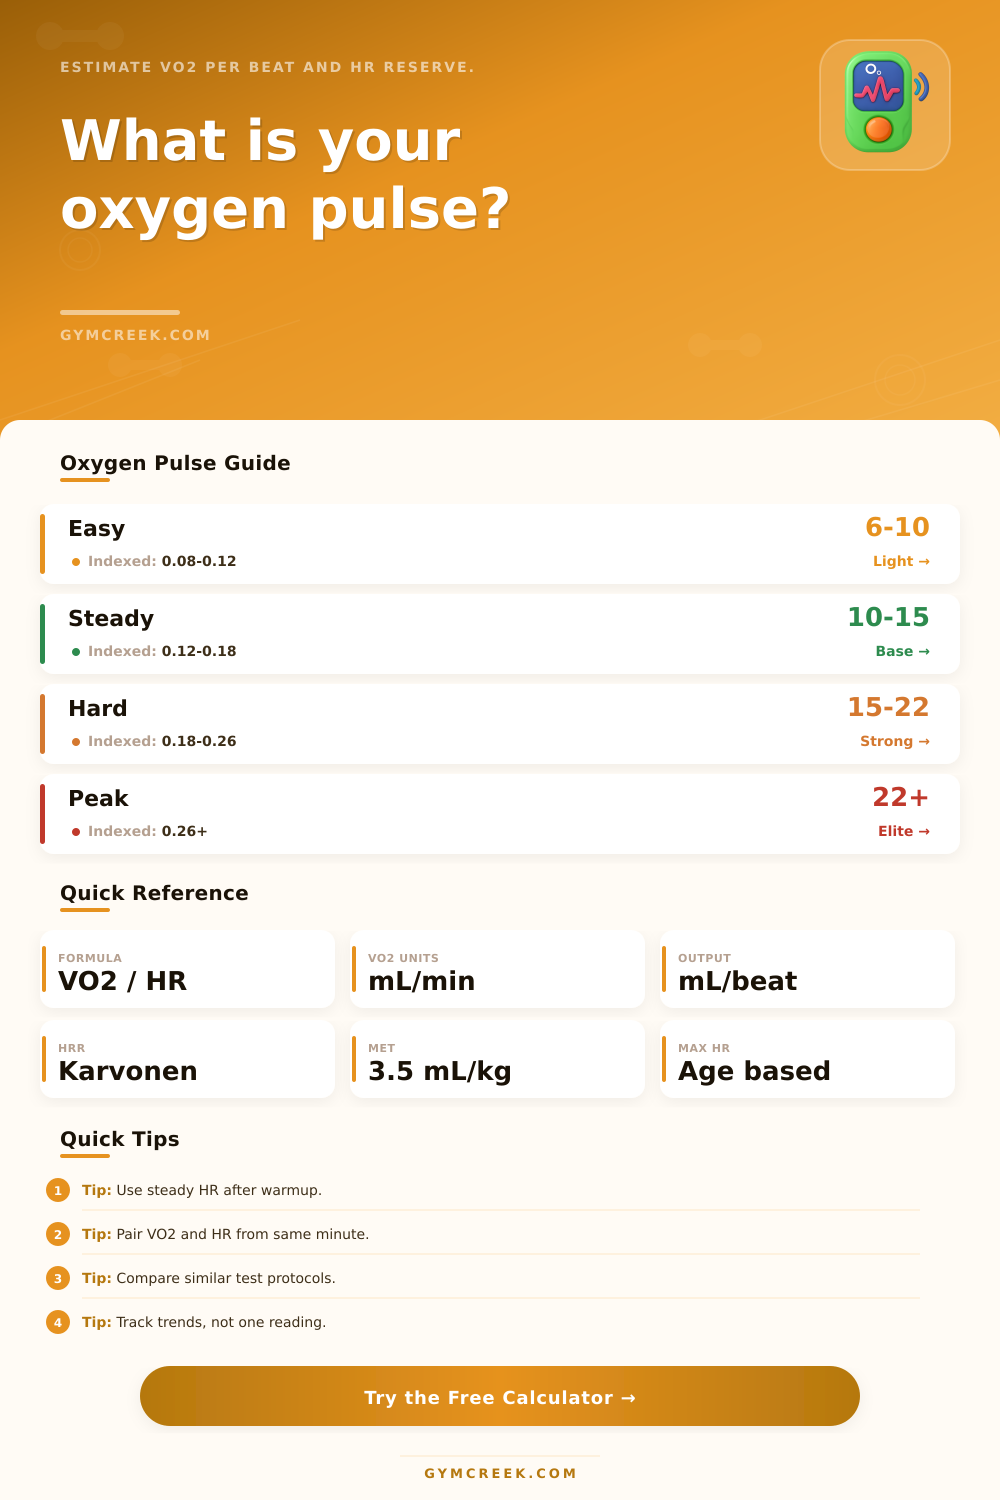
| Easy aerobic adult | 6-10 mL/beat | 0.08-0.12 | Light oxygen delivery demand |
| Recreational endurance | 10-15 mL/beat | 0.12-0.18 | Steady aerobic output |
| Well-trained endurance | 15-22 mL/beat | 0.18-0.26 | Strong delivery at higher HR |
| Elite aerobic capacity | 22+ mL/beat | 0.26+ | Very high stroke-volume proxy |
| Zone | % HRR | Purpose | O2 Pulse Pattern |
|---|---|---|---|
| Recovery | 30-50% | Easy circulation | Lower VO2 per beat |
| Endurance | 50-70% | Aerobic base | Usually rises smoothly |
| Tempo | 70-85% | Sustained work | Near stable plateau |
| VO2 interval | 85-95% | High aerobic stress | High or plateaued pulse |
| Protocol | Assumed Effort | a-v O2 Factor | Use Case |
|---|---|---|---|
| Recovery or easy | 0.52 of max | 90 mL/L | Low strain checks |
| Steady endurance | 0.68 of max | 120 mL/L | Base comparison |
| Threshold session | 0.82 of max | 140 mL/L | Sustained hard work |
| Hard interval | 0.90 of max | 150 mL/L | Repeat quality |
| Peak or ramp test | 0.98 of max | 160 mL/L | Maximal estimate |
| Formula | Variables | Output | Why It Matters |
|---|---|---|---|
| Oxygen pulse | VO2 mL/min / HR | mL/beat | Shows oxygen use per heartbeat |
| Relative VO2 | VO2 / body mass | mL/kg/min | Normalizes aerobic work size |
| Karvonen HRR | (HR - rest) / reserve | % HRR | Compares intensity by reserve |
| SV proxy | O2 pulse / a-v O2 | mL/beat | Estimates delivery trend only |
💡Tips
If you’ve talked with other runners, you’ve probably heard them proudly reciting their maximum or resting heart rate. While that’s half the story, there’s a little more tucked away inside, how much oxygen is your body pulling in with every beat of your heart? For competitive athletes, this number are called your oxygen pulse, and it’s one of the most telling metrics for cardiovascular efficiency. It take away all the noise and lets you see what your body can deliver.
You don’t even have to do complicated dividing when you’re huffing and puffing: the Oxygen Pulse Calculator here will take care of that for you after you input your heart rate and VO2 values. Sounds easy enough on paper, but in practice it’s deep. Divide amount of oxygen you consume by your heart rate to get your oxygen pulse; this tells you how many milliliters of oxygen is delivered per beat.
What Is Oxygen Pulse?
Picture your lungs as a warehouse, and your heart as a delivery truck. If you have a high oxygen pulse, then each trip are carrying a lot. This means your muscle is good at extracting oxygen and your stroke volume are strong. Low number? That means smaller trips and lighter loads; it is typically an indicator of working hard without moving much product. That alone make all the difference when interpreting a hard workout.
The big mistake most folks make is that they grab their heart rate data from some random point in time during the workout. But heart rate lag behind; when your heart rate spikes at the beginning of an interval, that doesn’t represent the steady state of what you’re doing.” To get accurate data, you want consistent numbers. To do that, you must have the heart rate value and the VO2 value for exact same minute in order to get accurate results. How precisely you time that doesn’t matter more than the fact that you are pairing those two values correctly.
Using a wearable device or going into the lab with a metabolic cart both work. However, if you don’t pair these together, you’re creating noisy data. This data appears to be a trend line, but it really isn’t because you didn’t sync things up correctley. It’s a fine point, but if you ignore it, you’re screwing up the signal.
But the reference table on the page provide some context in general terms. Six-ten milliliters per beat may be an easy aerobic pace, whereas a top-level endurance athlete might produce two dozen or more. This puts your reading somewhere along a range of human performance. That said, it’s not a good idea to compare yourself across the table. What is normal for me is different than you because of my age, sex and exercise history.
Watching how your oxygen pulse change at any given workload as you age is a better indicator then looking at one single number. It demonstrates that your heart are getting smarter by pumping more blood with fewer beats. That leads to indexed oxygen pulse, which is calculated by dividing the number by your body mass. In effect, it adjust for the fact that bigger runners (larger body mass) may have an inherent advantage simply based off their size alone.
It ignores how much tissue need oxygen and focuses on how well the cardiovascular system delivers oxygen relative to that. So even if two cyclist both has an equal score in terms of absolute VO2 max, they can be vastly different potential racers. That’s because the former has a higher indexed pulse. He or she is delivering oxygen more efficienty for every kilogram of tissue. It’s about economy, not just power.
The other element of enlightenment is that the tool calculate what’s called heart rate reserve. It will take into account your estimated max and your resting heart rate and give you an idea of how much (as a percentage) of your usable capacity you’re using. That’s calculated from the Karvonen formula, which tends to be more effective than just a percent of your max heart rate because it accounts for your starting fitness level. The lower your resting heart rate the bigger your reserve. So you can spend more time closer to the ceiling climbing with more space left to play. Knowing where you sit in the equation will allow you to plan your training while not blowing up too soon in the season.
Finally, this is all just a way to see the machine from within. It’s moving past surface level effort and into the physiological realm. There is no reason to run out to the lab to begin tracking your numbers. But there should of been a reason to test consistantly and notice trends. Keep conditions similar, trust the math, and let the data guide you when building your base. The heart has its own logic, and now you can see exactly what happens with every beat.