Overhead Press to Bench Ratio Calculator
Estimate strict overhead press and bench press one-rep maxes, compare the ratio, and see whether your pressing profile is bench-dominant, balanced, or overhead-press biased.
📌Press Ratio Presets
Presets load realistic lift numbers, rep ranges, body size, equipment, and technique assumptions, then calculate the ratio from estimated one-rep maxes.
⚙Calculator
Pressing balance profile
Enter bench press and overhead press sets to estimate one-rep maxes and compare the overhead-to-bench ratio.
📊Fitness Metrics Grid
📑Reference Tables
| Ratio Band | Classification | Common Meaning | Useful Next Check |
|---|---|---|---|
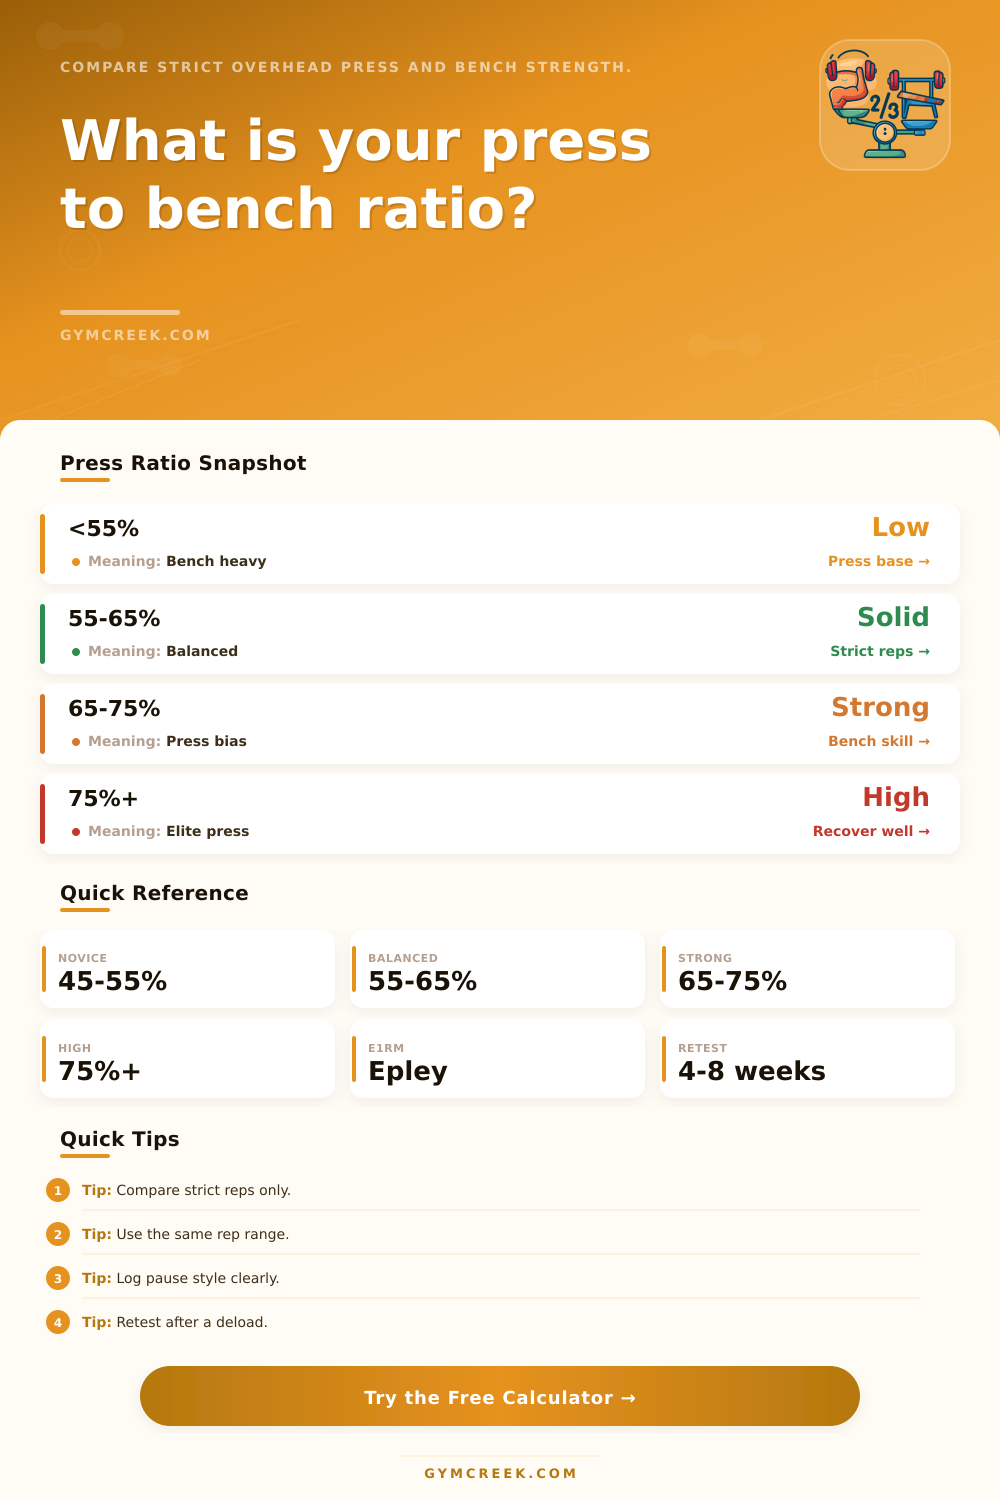
| Under 50% | Low overhead ratio | Bench strength strongly outpaces strict press strength. | Check strict press setup and shoulder comfort. |
| 50% to 55% | Developing | Common for newer lifters or bench-specialized training blocks. | Compare rep ranges before changing programming. |
| 55% to 65% | Balanced | Typical practical range for many trained lifters. | Maintain technique standards on both lifts. |
| 65% to 75% | Strong overhead | Overhead press is notably strong relative to bench. | Check whether bench technique is limiting output. |
| Over 75% | Very high ratio | Usually overhead-specialized, bench-limited, or style-mismatched. | Confirm strictness and test both lifts fresh. |
| Input Standard | Calculator Adjustment | Why It Matters | Best Use |
|---|---|---|---|
| Paused bench | Adds small bench context credit | Paused reps are stricter than touch-and-go reps. | Competition-style comparison. |
| Close-grip bench | Flags triceps-heavy benching | Close grip can reduce bench e1RM versus wider grip. | Comparing pressing muscles more evenly. |
| Push press | Penalizes ratio score | Leg drive inflates overhead load versus strict press. | Event-specific overhead work. |
| Seated press | Applies mild style caution | Seated pressing changes stability and torso contribution. | Machine-free upper-body comparison. |
| Log or axle press | Applies implement caution | Non-barbell implements change clean, rack, and lockout demands. | Strongman context only. |
| Profile | Typical Ratio | Likely Limiter | Interpretation Cue |
|---|---|---|---|
| New strength trainee | 45% to 55% | Strict press skill | Build consistent bar path first. |
| Balanced intermediate | 55% to 65% | Normal lift variance | Retest both lifts under the same fatigue state. |
| Bench specialist | 45% to 58% | Overhead exposure | Low ratio may be training-specific, not a flaw. |
| Overhead specialist | 65% to 78% | Bench technique | High ratio can reflect practice bias. |
| Masters lifter | 50% to 65% | Recovery and joints | Shoulder comfort matters more than the ratio alone. |
| Formula | Variables | Used For | Note |
|---|---|---|---|
| Epley e1RM | Load and reps | Main one-rep max estimate | e1RM = load x (1 + reps / 30). |
| Brzycki e1RM | Load and reps | Cross-check estimate | Best with lower rep sets. |
| Ratio percent | Press e1RM and bench e1RM | Main comparison | Ratio = press / bench x 100. |
| Bodyweight multiple | e1RM and bodyweight | Relative strength context | Useful across lifters of different sizes. |
| Balance score | Ratio, style, comfort | Practical interpretation | Score is a guide, not a performance prediction. |
💡Tips
Why does the bench feel heavier then the overhead press? Why does your overhead press feel lighter? The answer lie in relationship between the two exercises.
Commonly, most people assume strict press should of roughly sixty percent of their bench. In reality, however, this number change based off individual’s body proportions and training history. Also, it depends on how you execute movement. Because of this, it makes sense to track this ratio. It will show how much time you have spent learning each pattern, and it can show if one limit you more then the other, either your bench technique or your overhead skill.
How to Compare Your Bench and Overhead Press
What you see on paper is only half of it though. You select strictness level of every movement in your most recent workout which sets stage for how much work that lift involve. Touch-and-go sets are very different animal than a paused competition bench. Strict standing presses differs significantly from a push press, which will be up relative to a strict overhead lift. This matters because these choices impact final ratio you’re measuring.
One week, you might seem balanced. Another week, you could be press dominant, just based on how fresh your bench session is compared to how much freedom you have in the overhead session (i.e., more or less leg drive). Keeping standard honest ensures comparison doesn’t become noise.
There’s also a layer of body proportion. In general, those who is taller with longer limbs find the overhead press more mechanically challenging compared to their bench. Sometimes shorter stocky lifter can get closer to matching their numbers on the bench. Bodyweight and height are included in the calculator. That help distinguish structural differences from training differences. Having a lower ratio on long limb might just be due to how long the limb is. It doesn’t automaticly translate into an inability to press.
Shoulder comfort and recovery play into this as well. If a lifter has a nagging case of irritated shoulders that cause them problems with overhead work, they’ll obviously post lower numbers in that area. And while they may have raw strength on their side, this bring their number down nonetheless. That is why we have the comfort rating come in as an input. It’s not part of the math, but flags when you might want to use more caution reading your result.
Age does much the same thing. For many masters athlete, they find their overhead numbers starts to move downward compared to the bench. This is due to joint tolerance and shrinking recovery windows. Use it as a snapshot rather than a verdict. Think of this as a snapshot of results instead of a verdict. One test will tell you where the two lifts are positioned for the day. Repeat comparison every four to eight weeks and see if gap is increasing or decreasing. Keep conditions as similar as possible when testing.
The ratio points you in direction of which movement need more attention if your goal is pressing balance. If you’re prepping for competition, the number might show that your focus in training align with demands of sport.
So what is the main point? The simple answer is that when you’re reasonably fresh, you should apply consistent standards to both and then log it. Consider the ratio a piece of data in a set of data points. Eventualy the pattern will be more evident than an individual test could show.