Orthostatic Heart Rate Calculator
Compare lying, seated, and standing pulse readings with timing, symptoms, hydration context, and non-diagnostic reference ranges.
📌Presets
Each preset fills a realistic orthostatic vitals scenario and calculates immediately.
⚙Calculator
Orthostatic heart rate result
Enter your readings to compare pulse response after standing.
📊Fitness Metrics Comparison
📑Reference Tables
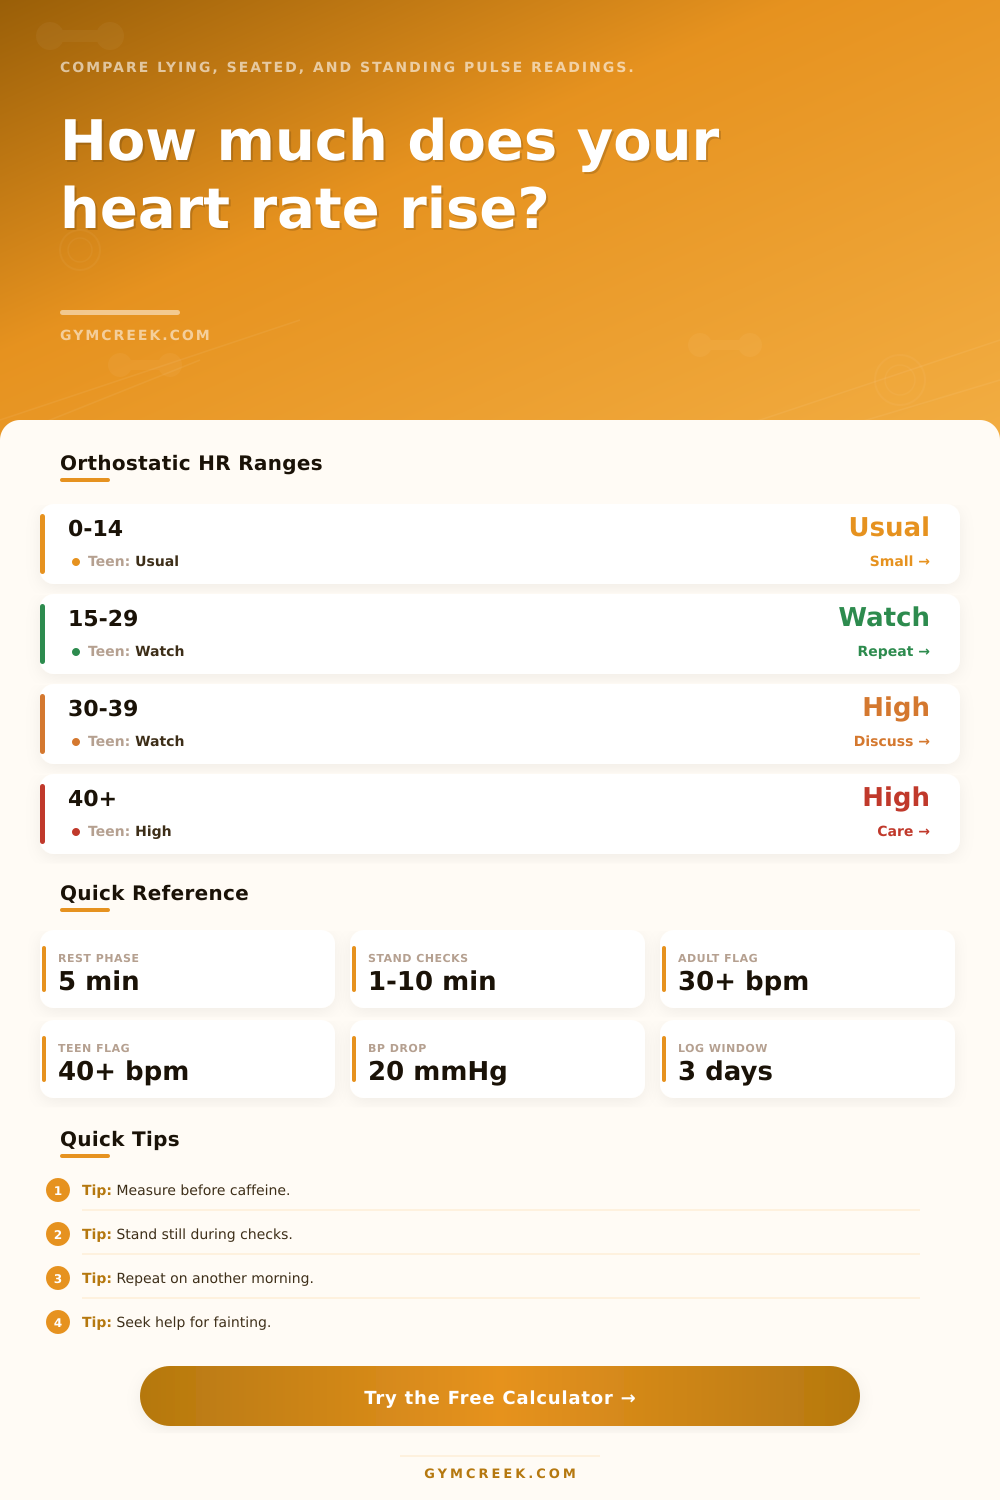
| Peak HR rise | Adult context | Adolescent context | What to do |
|---|---|---|---|
| 0-14 bpm | Common small rise | Common small rise | Track if symptoms occur |
| 15-29 bpm | Borderline or context driven | Often context driven | Repeat when rested |
| 30-39 bpm | Above common adult screen | Below common teen screen | Discuss if sustained or symptomatic |
| 40+ bpm | High screening range | High screening range | Consider clinical follow-up |
| Step | Timing | Measurement | Use in calculator |
|---|---|---|---|
| Quiet rest | 5-10 min | Lying HR and BP | Baseline pulse |
| Stand | 1 min | Early standing HR | Peak response check |
| Continue standing | 3-5 min | Sustained HR | Main stability trend |
| Optional longer check | 10 min | Late standing HR | Recovery pattern |
| Context | Common effect | Calculator adjustment | Interpretation note |
|---|---|---|---|
| Heat exposure | Higher standing HR | Adds context penalty | Retest cool and hydrated |
| Hard training | Higher resting or standing HR | Adds smaller penalty | Compare with recovery day |
| Low fluid | May raise pulse | Hydration flag | Log intake and symptoms |
| Caffeine or meds | May alter pulse or BP | Context flag only | Ask a clinician if unsure |
| Formula | Variables | Result | Best use |
|---|---|---|---|
| Peak rise | Max stand HR - baseline HR | bpm increase | Main pulse response |
| Sustained rise | Avg 3 and 5 min - baseline HR | bpm increase | Standing trend |
| Recovery ratio | (Peak - 10 min rise) / Peak | percent | Late stabilization |
| Stability score | 100 - pulse, BP, symptom penalties | 0-100 score | Fitness log comparison |
💡Tips
Everyone thinks of their heart rate as something constant, ticking up when they move around and then settling down again when still. But no: You can see from this tool that your heart rate changes depending on your body position (standing against gravity versus sitting or lying flat). That adjustment signals whether your autonomic nervous system can get the job done with pumping blood back up toward your brain. The tool above will help measure that change by showing you how different your baseline numbers are compared to when you’ve stood up.
An orthostatic test is easy enough on paper, lie down for several minutes; get a baseline heartbeat reading when you’re steady; stand up; watch your heart pound. But it’s all about timing: you should capture readings at one, three, five, and ten minutes. When you stand up, there’s immediate pooling of blood into your abdomen and legs which means your body has to respond fast.
How to Check Your Heart Rate Changes
When you stand up, there’s immediate pooling of blood into your abdomen and legs,” which means your body have to respond fast. To keep blood moving and pressures high, the heart rate shoots up and the vessels constrict. When it does so too much or too slowly, it overreacts and pumps your pulse far beyond where it should be. Taking multiple readings at one, three, five, even 10 minutes will give you a more complete picture than just what you see on your wrist.
It all comes down to context, which changes greatly depending on who you are and where you came from just before checking your heart rate. Fifteen-beat increase could be absolutely nothing to worry about for a sedentary adult following a light breakfast, but could indicate something worth monitoring for a dehydrated athlete. The calculator takes into account things such as hydration status, recent caffeine consumption, and if you have a particularly heavy training session the previous day.
Simply being out in the heat raises your standing pulse quite dramatically as your body moves blood to the skin for cooling purposes. You might freak out over a reading that actualy makes perfect sense in that environmental setting without taking these factors into consideration. When they run these checks on adolescents they get bigger jumps in heart rates compared to adults. Part of that is because they’re still growing and their cardiovascular system isn’t fully adapted yet. A jump of thirty beats per minute may simply be within there norm. For adults, we generally flag something as a concern when levels reach a little bit lower. If you use teenaged standards for an adult or athlete standards for someone who is sedentary (sitting at a desk all day), then it’s easy to read the wrong thing from the data. The interface has built-in reference tables that will sort through that group difference and make sure you’re not comparing yourself to the wrong population.
It’s not just about what shows up on the screen, it’s also about symptoms. For example, having a big jump in your heart rate without any sense of fatigue or bluriness/dizziness can be very different than a smaller jump where you feel like passing out. In addition to the pulse data, the tool allows you to log how severe each symptom is. Together, this should help distinguish between normal changes in your body and something like POTS or orthostatic intolerance. It’s also helpful for logging if you want to bring it to a clinician for additional evaluation.
This is the most difficult aspect: consistency. Test yourself right when you wake up? Different result from a test done after a bad night of sleep. Before or after that cup of joe? It will be different. How can you know what each situation really means and how to apply it? That’s where knowing what you’re really measuring comes into play. You want to measure the same thing in the same situation (at least as close as possible). To get the best comparisons, run the same process at the same time of day.
It is also worth noting that some folks report their fitbit/fitness watch lags when they change positions. For these tests, a manual count of fingers on your wrist or use of a chest strap will generally provide more consistent results. Finally, don’t overread any one test. One test done while hot, stressed, or dehydrated may be off. Instead look at the pattern across multiple days. Most folks miss the symptom of still feeling unwell after standing, especially when it takes longer than usual for their heart rate to settle down. That might point toward some sort of medical help or looking more deeply into how you approach salt or hydration.
This calculator, in the end, is a screening aid, not a diagnosis machine. It takes all the different bits of your vitals data and makes them into an understandable picture. Identify outliers. Track trends. If you’re feeling fine, go for it. If you’re feeling off, listen to yourself. You know when gravity is winning out on you, and these numbers can verify what your body’s been telling you.