Mile Time Predictor Calculator
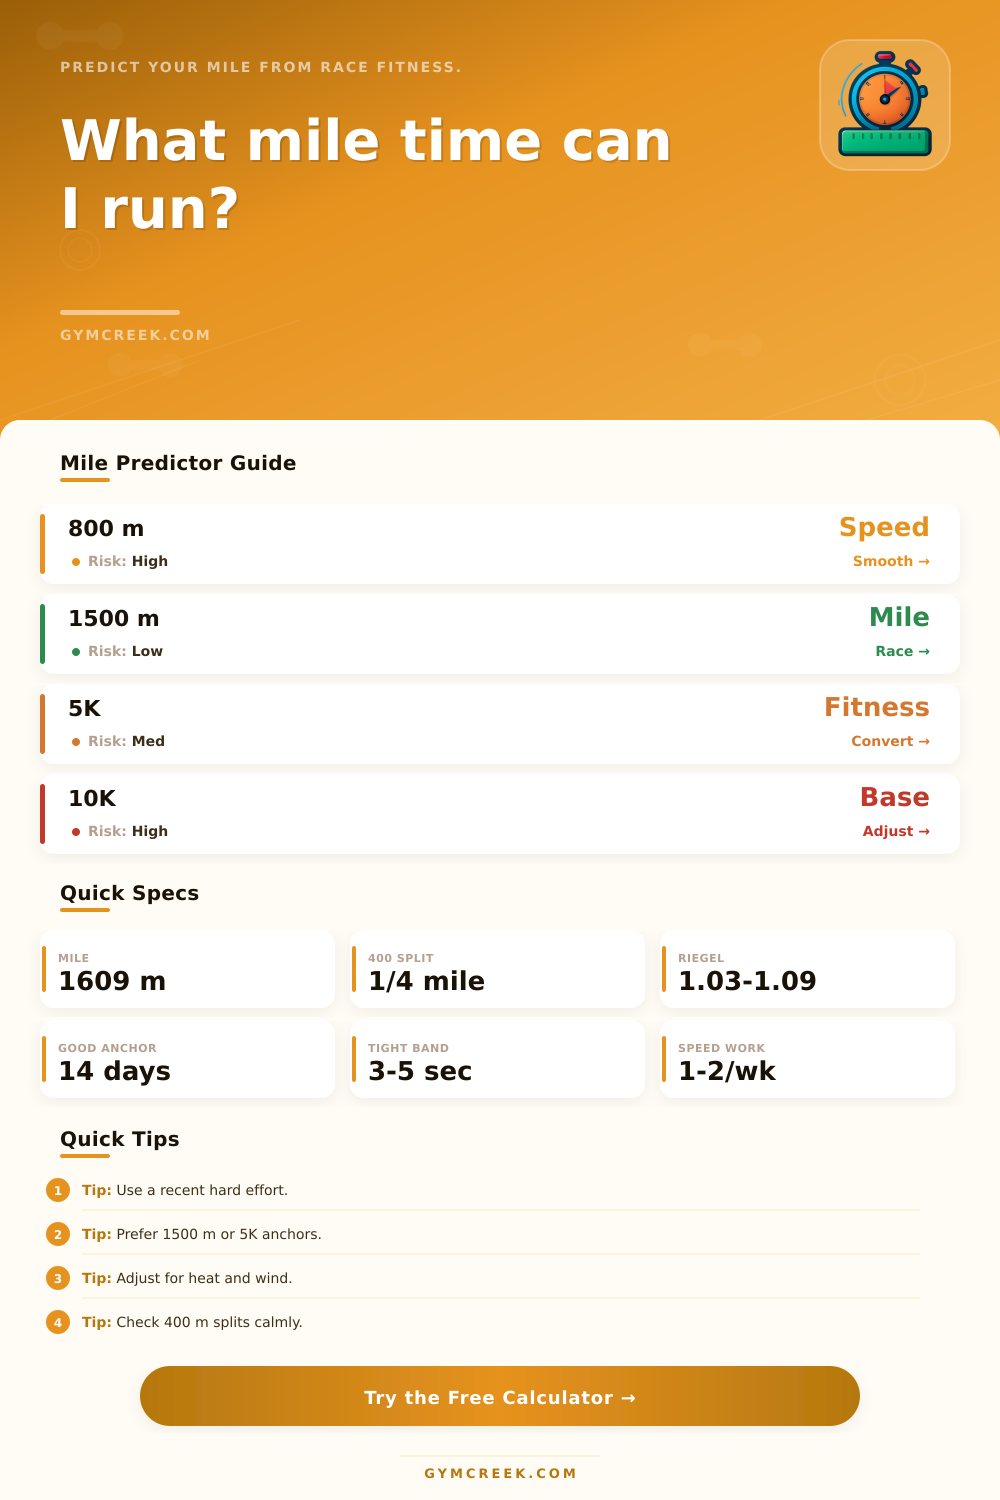
Predict a realistic mile finish from a recent race or time trial, then adjust for training volume, speed work, fatigue, surface, weather, age, and execution strategy.
📌Mile Predictor Presets
Presets load realistic race anchors, body context, weekly volume, speed sessions, fatigue, and surface conditions. Change any field after loading one.
⚙Prediction Inputs
Mile forecast
Enter a recent race or time trial to estimate your mile time, pace, readiness, and split plan.
📊Mile Metrics Grid
📑Mile Prediction Tables
| Segment | Target Split | Cumulative | Pacing Cue |
|---|---|---|---|
| --- | --- | --- | --- |
| Outcome | Mile Time | 400 m Split | Use This When |
|---|---|---|---|
| --- | --- | --- | --- |
| Component | Input Used | Effect | Reason |
|---|---|---|---|
| Riegel | Race anchor | Core | Distance conversion |
| Mile Time | 400 m Split | Typical Runner | Planning Note |
|---|---|---|---|
| 10:00+ | 2:30+ | New runner | Use smooth effort and finish upright |
| 8:00-9:59 | 2:00-2:30 | Recreational | First lap control matters most |
| 6:00-7:59 | 1:30-2:00 | Trained | Hold rhythm through lap three |
| 5:00-5:59 | 1:15-1:30 | Competitive | Practice race-pace 400s |
| Sub-5:00 | Sub-1:15 | Advanced | Small pacing errors get expensive |
💡Mile Prediction Tips
Running a quick lap around the track isn’t enough to predict a mile time. To know how long a mile will take with pace cranked and distance shrunk, you have to knows your fitness level. The last few seconds reveal every little decision about how hard you push.
If you’ve run a 5K recently, or even better a 1500m, then you’re sitting pretty, but there’s more to getting a realistic mile target from this number different than just adding zeros. Weather, surface, training volume, and recovery changes what is doable on any afternoon of the week.
How the Calculator Works
When you input this month’s benchmark along with what your body has been through during this training cycle into our calculator, it spits out an estimate. But why does it need all that? That’s where understanding the inputs come in.
Mileage is how many miles you’ve logged each week, so it takes into account your aerobic base. Weekly mileage tell the tool how much aerobic base you are carrying. Speed Sessions: How many speed workouts you complete each week indicates if you’re grinding consistent miles (low) or shaving seconds off every stride (high).
How recovered do you currently feel? Depending on fatigue levels, you may not be able to access as much of your potential fitness as you think come race day. Surface/Weather: Adjusts for the reality that running on a nice, flat track is very different than running a windy loop around town or during a muggy afternoon.
Why? It is because of experience. Experience changes the conversion equation. Someone new to running with basic stamina will be more cautious when turning that 5K time into a mile then someone used to competitive racing, where their pace translates better. The age input accounts for their ability to recover outside of the early twenties.
And the decision about how to execute (i.e., do you want to run out hard or save up for a strong last lap) allows you to model your approach so that you’ll predictably get a different result based off those choices, despite having the same amount of fitness. That’s the kind of real-world choice runners face, and those choices lead to different outcomes anyway.
It’s not just about a predicted time. There are also equivalent distances that shows what your 1500m or 800m would be at the same fitness. This is useful if you want to try out your speed but don’t want to run all the way to a mile, for example.
The split plan provides you with something to focus on in terms of pace (aiming for a rhythm) versus “just go really hard.” The range table shows how far off the mark you could be depending on whether your legs and conditions is better or worse than expected. This provides a helpful benchmark when you choose a target time as opposed to crossing your fingers and hoping for the best.
While most runners understand how to input data correctly, they don’t interpret the outputs well enough. Getting a high confidence score doesn’t make you run faster. It just indicates that the anchor you provided was relatively fresh and likely representative. Having a low readiness score doesn’t indicate you’re in bad shape. It simply means you’re fatigued (or over-trained) at the moment and it would of been best to wait until another day to run at your peak effort level.
The utility lies in using the output as a planning aid; not a predictive tool against which you try to compete. It’s no different with racing… Weather changes from practice to race day. A calm, cool morning on the track will never be the same as a warm, windy afternoon on the road. Tell the calculator what kind of day it’ll be and it takes this into account.
What happens next depends on whether you are honest about how your legs feel and how well you can adjust if the first lap doesn’t feel like the one you trained for. It should of been more naturaly easy to see.
If you want a luxurius experience, training matters. This moddern method works.