Mean Propulsive Velocity Calculator
Estimate bar speed, relative load, power output, and projected 1RM from range of motion, concentric time, load, and lift type.
📌Presets
Each preset changes the exercise profile, load, ROM, timing, and target zone before calculating.
⚙Calculator
MPV snapshot
Enter load, ROM, and propulsive time to estimate bar speed.
📊Velocity Metrics
📑Reference Tables
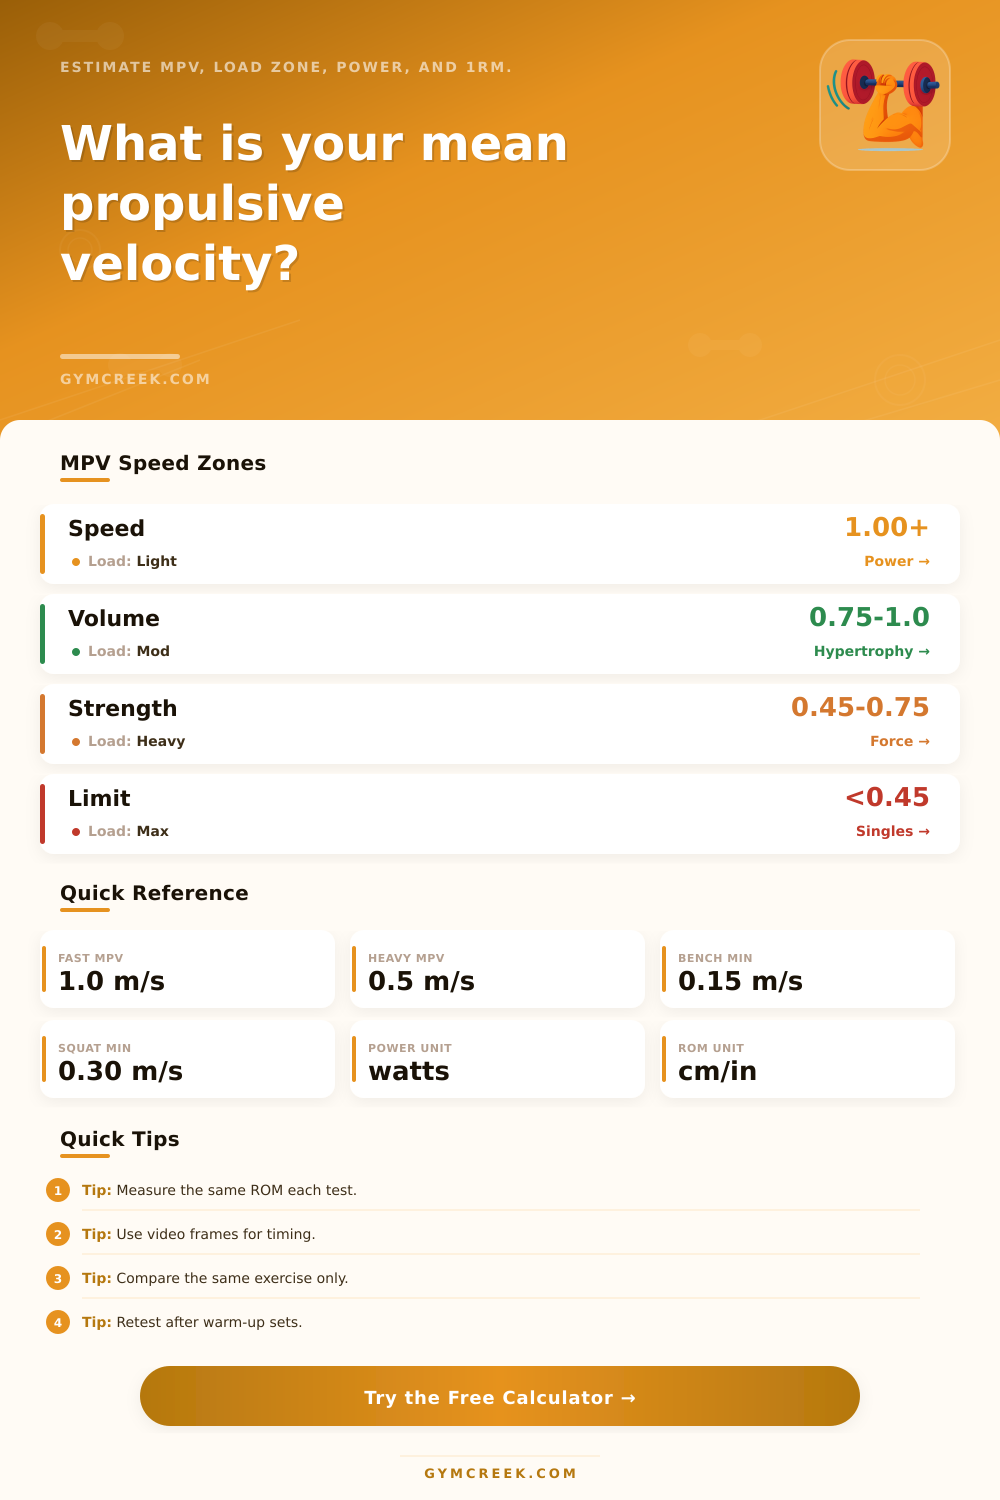
| MPV Zone | Typical Range | Load Feel | Training Use |
|---|---|---|---|
| Speed-strength | 1.00 m/s+ | Light | Power and acceleration |
| Hypertrophy volume | 0.75-1.00 m/s | Moderate | Fast repeat work |
| Strength work | 0.45-0.75 m/s | Heavy | Force production |
| Near max | Under 0.45 m/s | Very heavy | Heavy singles and testing |
| Exercise | Min Velocity | Fast ROM Note | Best Comparison |
|---|---|---|---|
| Bench press | 0.15-0.20 m/s | Bar to lockout | Same grip and pause |
| Back squat | 0.30-0.35 m/s | Hole to standing | Same depth standard |
| Deadlift | 0.18-0.25 m/s | Floor to knees plus finish | Same start height |
| Overhead press | 0.20-0.30 m/s | Shoulders to lockout | Same leg drive rule |
| Measurement | How It Enters | Common Error | Better Practice |
|---|---|---|---|
| ROM | Distance divided by time | Using full body travel | Track bar path only |
| Time | Propulsive phase duration | Including long pauses | Start at upward drive |
| Load | Power and 1RM estimate | Mixing units | Keep unit setting consistent |
| Reps | Velocity loss estimate | Averaging sloppy reps | Use clean comparable reps |
| Scenario | MPV Signal | Likely Action | Watch For |
|---|---|---|---|
| Warm-up jumps | Faster than target | Add load gradually | Technique staying sharp |
| Main work stalls | Slower than target | Reduce load 2-5% | Large velocity loss |
| Power day | Above 1.0 m/s | Keep intent high | ROM shortening |
| Heavy single | Near min velocity | Stop after clean rep | Grinding pattern changes |
💡Tips
When you go to the gym, you notice people moving weight at different speeds and yes, speed of movement are important to your results. Maximum strength, muscle size and power is all built through different velocities of movement.
When you’re fatigued, your nervous system tricks you into guessing your effort level. You think “I’m tired, I must be working hard.” That’s subjective. Your bar speed doesn’t lie, it’s a better gauge of your effort.
Why Bar Speed Matters for Your Workout Results
The lift’s mean propulsive velocity is more physics-based approach that removes the guesswork by focusing on bar speed. Rather than looking at total speed (up plus down), it looks only at speed when the bar is being lifted up. It does not consider pause at the bottom or the downward (eccentric) part of the rep. That’s because force production occur during this period. Your numbers will be skewed if you count rest periods or negative portions as part of your calculation.
All you need to do is plug in your time and range of motion into the calculator and let it do the math for you, no need to fumble with converting units while trying to control heart rate between sets. But it’s not just about gathering information. It matters much more to understand what those numbers represent in terms of training.
When you’re going above one meter per second, you’re typically talking about working on acceleration and power. The weight feels light but you need to be making maximum use of your intent. If you dial in a little lower and get down around zero point seven to one, then you’re probably in the muscle growth zone. You’ll have good movement quality with a lot of mechanical tension. If you go below zero point four five meters per second, you’re moving pretty close to max effort. That’s heavy strength work. The bar isn’t going very far and there’s a ton of load on it, but again, you want to keep your intent aggressive.
But once you start to lose form at that speed, you’ve gone below range of motion that’s good for increasing strength. Getting the input part right takes some discipline and most likely stumbling block is range of motion. What does that mean? Measure how far the bar actualy moves during the propulsive phase of the lift (not the whole rack height nor the full travel path of your body). Your bench press range might be fifteen inches from your chest to lockout. Your squat range might be from the bottom of the squat to standing.
Measuring that distance accurately, even slightly can have a huge impact on accuracy of your velocity estimate. Video analysis or having a reliable velocity device really help here. A two inch error in what you think your range of motion is can throw your estimated speed off. This can lead to an incorrect assessment of your effort level. That’s a small detail but it makes all the difference over time.
Secondly, take into account velocity loss throughout your set: most people don’t move at max speed on each rep. As fatigue sets in, the bar will slow down. Monitoring that decline can signal when it’s time to put the bar down. For power output work, you may be okay with greater velocity loss compared to strength work. You can also include that in the tool. It provides a more realistic picture of total reps’ stimulus (vs just the initial one).
That’s what differentiates structured programming versus casual lifting. To conclude. Mean propulsive velocity helps make training less of an art and more of a science. Instead of wondering whether it is time to increase weight, decrease weight, or cease lifting all together, you have objective points to guide your decision-making. No longer are you guided by fuzzy mental images of feeling burned out; instead, you respond based off tangible results.
Because those numbers don’t give a f, if you slept poorly the previous night or avoided leg day last week, they simply represent what you accomplished during that time. When you pay attention to speed, you take back the wheel. You can dial-in loads precisely and ensure that each workout does exactly what it was designed to do. No wasted efforts spent struggling against useless resistance.
You should of seen how much better results would be.