Percentage of Max Heart Rate Calculator
Estimate maximum heart rate, target bpm from a chosen HRmax percentage, equivalent heart rate reserve intensity, zone placement, and session strain from age, resting pulse, known max, training goal, and context.
📌Heart Rate Presets
Presets load realistic ages, resting heart rates, target percentages, goals, activity levels, and context modifiers for common endurance and gym cardio sessions.
⚙Calculator Inputs
Max heart rate percentage snapshot
Enter your age, resting pulse, target percent, and session context to estimate bpm ranges and zone fit.
📊Heart Rate Metrics
📑Heart Rate Reference Tables
| Model | Formula | Calculated Max | Best Use |
|---|---|---|---|
| Tanaka | 208 - 0.7 x age | --- | General adults |
| Zone | % Max HR | BPM Range | Typical Use |
|---|---|---|---|
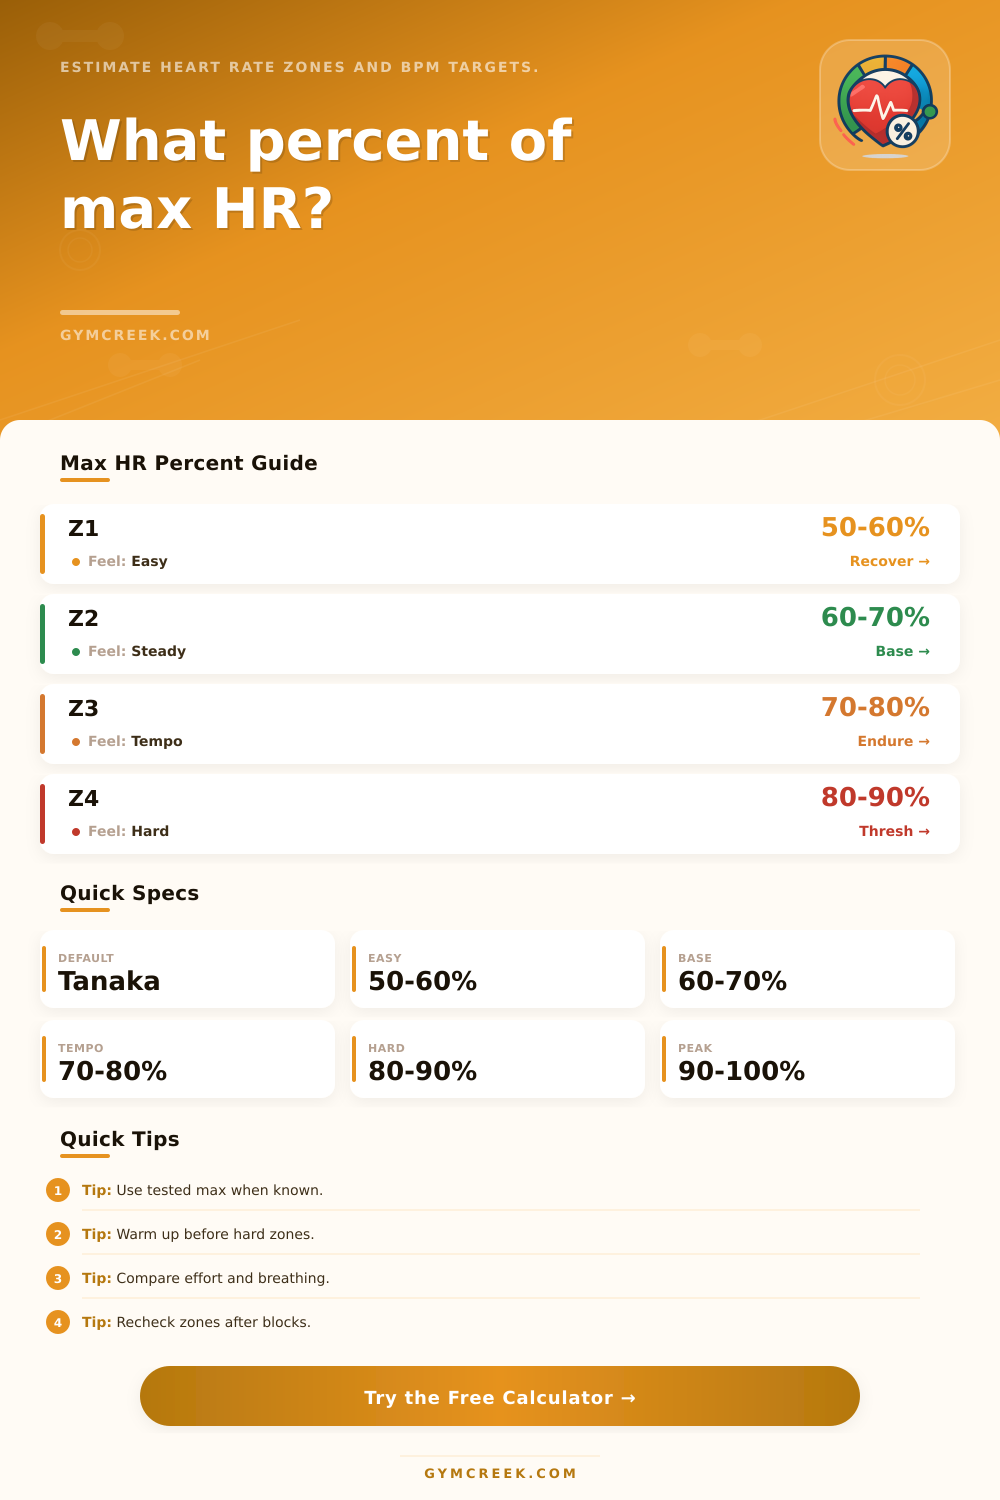
| Zone 1 | 50-60% | --- | Recovery |
| Goal | Usual % Max | Breathing Cue | Watch Point |
|---|---|---|---|
| Recovery | 50-60% | Full sentences | Keep it easy |
| Aerobic base | 60-75% | Talk in phrases | Avoid drifting hard |
| Tempo | 75-85% | Short phrases | Limit total time |
| Threshold | 85-90% | Few words | Needs recovery |
| VO2 intervals | 90-100% | Hard breathing | Use sparingly |
| Factor | Likely Effect | Calculator Adjustment | Practical Note |
|---|---|---|---|
| Running | Higher HR | --- | Impact and heat matter |
💡Heart Rate Tips
Heart rate training feels precise, but your max heart rate is almost never a fixed number because it shifts based off how well you slept the night before, the temperature outside, and your current state of physical fitnesss and age. That means there’s no exact heart rate to chase (since your maximum isn’t just a fixed number you can look up on a chart), so many folks use their percentage of max heart rate as guidance. It provides training zones that is usable; you don’t have to get tested at the lab each season.
That’s where the math begins. First we come up with a best guess as to our max. The formula vary by age, and some work better for specific populations. Then we determine which portion corresponds with whatever slice of the pie we’re after during a given training session. At one end of the spectrum are recovery rides. Threshold work is somewhere towards the other end. What really comes into view is when you overlay slices from different formulas. Now you can visualize how a few tweaks to the model affects the targeted beats per minute.
How to Calculate Your Heart Rate Zones
Another layer is resting heart rate: It indicates amount of headroom available to you. Two athletes may have identical maximums, yet one who rests at 45 beats carry vastly more reserve than one who rests at 70. The calculator takes that into account, transforming your selected percentage into not just a straight-up max heart rate range, but also a corresponding heart rate reserve number. Why? Because you might use this calculator to compare training sessions over days when your resting rate fluctuate.
It gets murkier still when we consider context. On a cold day, 100 percent tempo is going to feel different then it does in humidity on an afternoon you didn’t sleep so well. Your primary numbers are adjusted by current conditions, your fitness background, and your activity level. These factors determines your caution score and your estimated recovery time. This isn’t a replacement for common sense but rather surfaces those variables that tend to be overlooked until the workout seem more difficult than anticipated.
On this page, the reference tables allows you to visually see where within the wider zone system you’ve placed yourself with your selection of range. And then you can review if the session you’re planning falls at the endurance end of the scale. You can also see if it threatens to push toward threshold without needing to memorize all cut-off values. The nearby goal-fit score shows how well the percentage choices fit the demands of your intended training focus. If it’s good, it tells you your session will likely achieve what you expect. If the score is not so good, it alerts you that perhaps you should of adjust the intensity or duration before beginning.
But folks tend to take these numbers as hard-and-fast guidelines, not a baseline for where they should start. Instead, it’s better to note each day when their breathing, pace, and effort match the numbers on range. If it seems like it’s all going easier than the calculator predicts, maybe it turns out you’ve gotten stronger since you last inputted data. Maybe it feels more difficult, but that was probably just because of an off day, the heat, or fatigue, dragging the answer higher.
The real key habit is consistently measuring your resting heart rate and checking back periodically against the model you trust. By updating them little by little, it keep the zones accurate over time without making every workout a math problem.