Maintenance to Deficit Calculator
Estimate maintenance calories, choose a realistic deficit, and compare daily targets, weekly energy gap, and projected fat-loss pace.
📌Presets
Pick a scenario to load realistic body stats, activity, step volume, and deficit settings before fine-tuning.
⚙Calculator
Maintenance to deficit snapshot
Enter your stats to estimate maintenance and a realistic cut target.
📊Deficit Metrics
📑Reference Tables
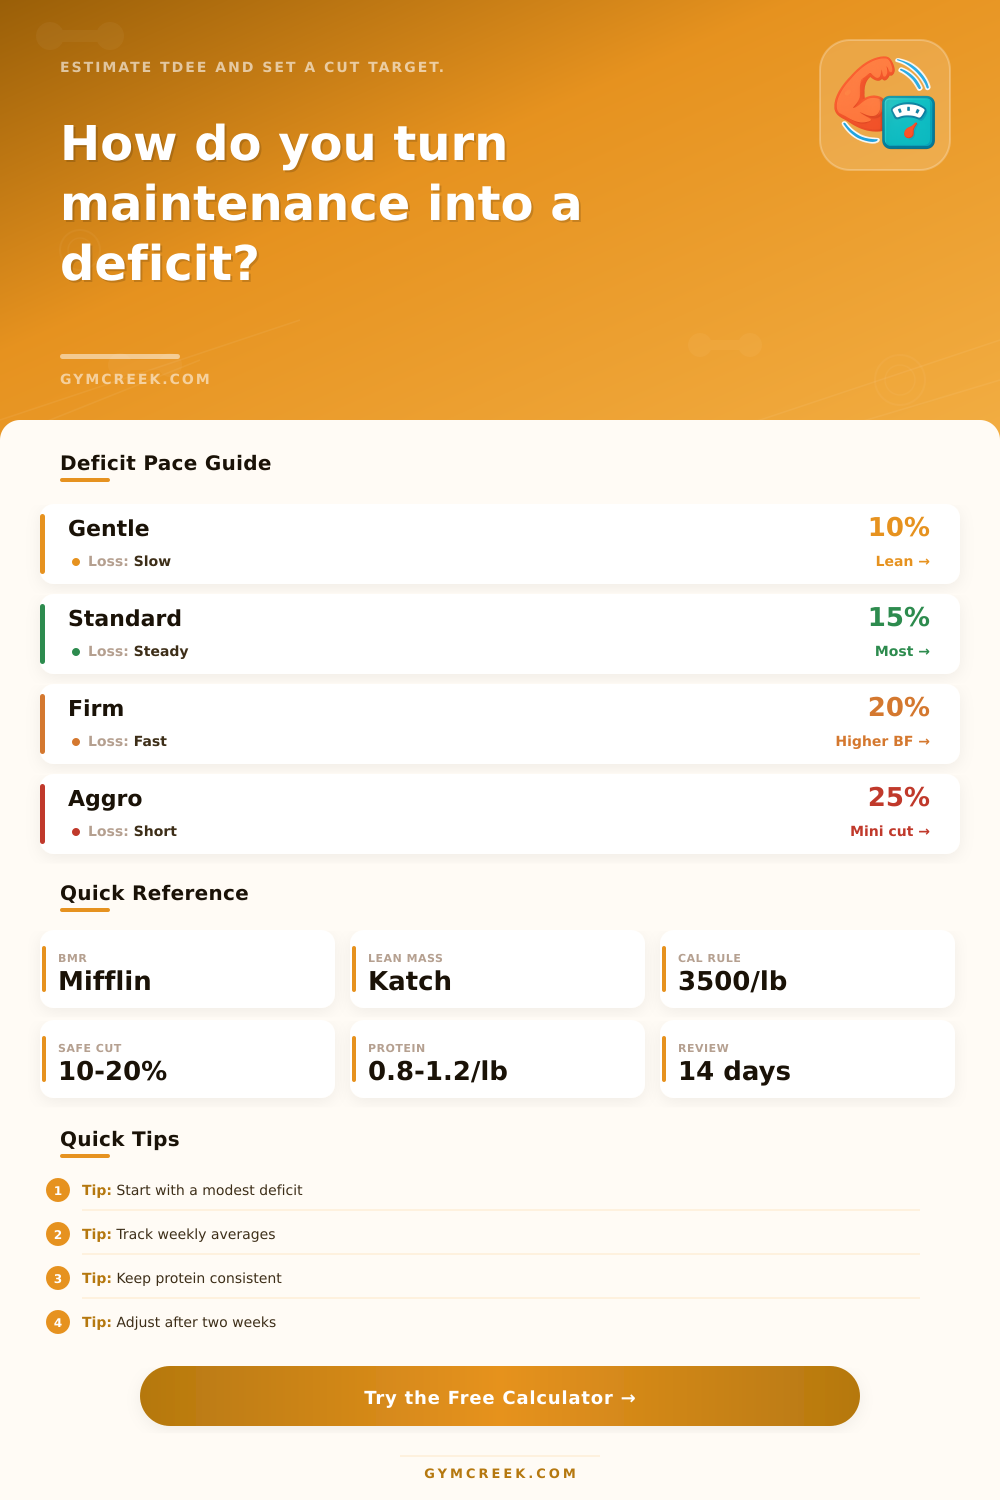
| Deficit | Daily gap | Weekly pace | Best use |
|---|---|---|---|
| 5 to 10% | Small | Slow | Lean lifters, performance phases |
| 10 to 15% | Moderate | Steady | Most sustainable cuts |
| 15 to 20% | Firm | Faster | Higher body fat or short blocks |
| 20 to 25% | Large | Aggressive | Mini cuts with close monitoring |
| Level | Factor | Typical steps | Training read |
|---|---|---|---|
| Sedentary | 1.20 | Under 5k | Desk work, little exercise |
| Light | 1.375 | 5k to 8k | Some walking or light gym |
| Moderate | 1.55 | 8k to 12k | Regular training week |
| Very active | 1.725 | 12k plus | Hard training or active job |
| Check | Green zone | Caution zone | Why it matters |
|---|---|---|---|
| Loss rate | 0.5 to 1.0% | Over 1.25% | Recovery and adherence |
| Protein | 0.8 to 1.2 g/lb | Under 0.7 | Lean mass support |
| Fat floor | 0.25 to 0.4 g/lb | Under 0.2 | Diet quality and hormones |
| Review span | 14 days | Daily changes | Weight noise is normal |
| Formula | Use | Inputs | Output |
|---|---|---|---|
| Mifflin-St Jeor | BMR baseline | Age, sex, size | Resting kcal |
| Katch-McArdle | Lean check | Lean mass | Resting kcal |
| TDEE | Maintenance | BMR and activity | Daily kcal |
| 3500 rule | Loss estimate | Weekly gap | Scale pace |
💡Tips
Cutting too much food mean you are treating calorie deficits as punishment. The plan relies on emotion rather than data so when your willpower falters, you’ll eat less and then overeat. How can you reach a goal if you don’t know where you started? Before you can guess your way to the right numbers, you must first know what your starting point is.
Your baseline maintenance estimate need be right or else every number after that will also be a guess. So it takes care of that for you. Combining the metabolic formulas with its list of activity factors.
How To Use The Calculator
First, there are calories you’re burning at rest, which is called basal metabolism. It will take your inputted details, like your height, weight, sex and age. And calculate Basal Metabolic Rate, or the number of calories your body would burn if you were lying in bed asleep. That number slowly shifts as you age and build muscle.
Next: It will multiply that by your activity factor, which depends on what you typically do throughout the week. Because someone who sits at a desk all day and another person who hikes on weekends have totally different metabolisms. They may look the same but their bodies is burning different fuels. To help you not under-estimate what a little bit of activity does burn, it has a step count/training frequency reference table to match to a multiplier.
Most plans goes wrong here: picking the correct deficit size. Ten percent cuts are gentle, saving enough energy for sleep and workouts, but you may not feel like you’re moving quickly enough on scale. Twenty-five percent drops gets that needle moving fast, but they’ll crash your performance and mood in just a few weeks. This tool lets you see both of those paces side-by-side, and tells you exactly how many calories you’d have to eat every day to reach any weekly loss rate.
Most folks does best with a modest start and an adjustment after a couple of weeks, instead of jumping right into the deep end. It gives your body time to adjust to this lower fuel level before hitting the severe hunger hormones or slowing down your metabolism.
One other thing that gets overlooked as calories tighten up: protein intake. Your body will look for energy wherever it can get it, and that includes your muscle tissue when calories is low. Maintaining high protein helps to save this lean mass and ensure you lose weight from fat stores and not than your strength potential. The calculator calculate a protein target per day for you based off your body weight and how many days you train, which gives you a specific amount of grams to shoot for.
That’s not some arbitrary number, it’s a signal to your body that you’re eating enough so there’s no need to tap into muscle for energy. Add enough fat to this to keep your hormones healthy, and you’ll have a nutritionally complete cut instead of an empty one.
Spreadsheets are never perfect, real life isn’t like that. There will be days when you’ll eat under or over, there will be weeks with extra stress or work deadlines cancelling your training. Instead of getting hung up on these daily fluctuations, focus instead on looking at the overall average for the week. Because weight fluctuates due to things like digestion, salt intake, and water retention, one day’s number don’t mean much.
Looking at the trend across fourteen days paints a much clearer picture of how your current deficit is working (or not). If after two weeks you’re not seeing any movement on the scale, tweak something: Either bump your activity a bit or drop your calories a little. It’s a negotiation between you and your biology, not a war on your body.
You start by estimating your realistic maintenance level, then add a small deficit while guarding against protein loss. This means making gradual changes that you can sustain for long enough to create noticeable change before burning out. When you know how to do the math of the burn, the guesswork dissapears.