Lactate Threshold Power Calculator
Estimate lactate threshold power, FTP, critical power, W/kg, and training zones from a time trial or two-effort power test.
📌Presets
Presets load real testing styles: single time-trial FTP estimates, critical-power paired tests, and conservative threshold adjustments.
⚙Calculator
Threshold power snapshot
Enter test data to estimate your sustainable threshold range.
📊Metrics Grid
📈Live Power Zones
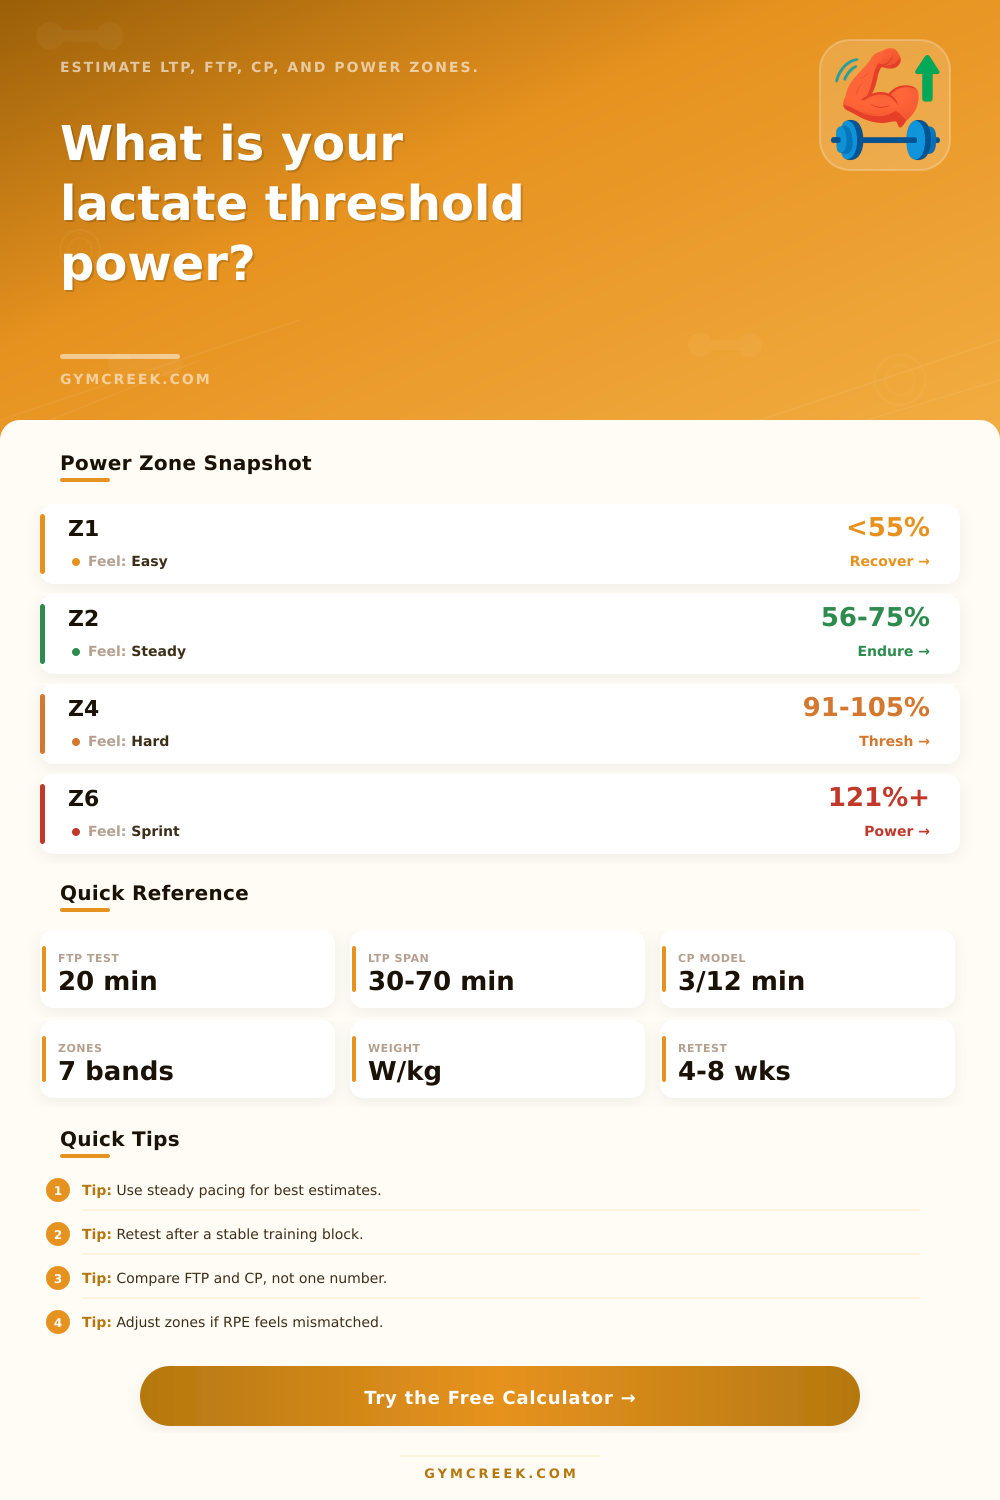
| Zone | Range | Watts | Training Use |
|---|---|---|---|
| Z1 Recovery | <55% | --- | Easy spins and recovery rides |
| Z2 Endurance | 56-75% | --- | Base aerobic work |
| Z3 Tempo | 76-90% | --- | Steady endurance pressure |
| Z4 Threshold | 91-105% | --- | Sustained hard intervals |
| Z5 VO2 max | 106-120% | --- | Short high-aerobic intervals |
| Z6 Anaerobic | 121-150% | --- | Hard repeats and attacks |
| Z7 Neuromuscular | 151%+ | --- | Sprints and starts |
📑Reference Tables
| Test Type | Best Input | Base Formula | Use Case |
|---|---|---|---|
| 20-minute TT | Avg 20-min W | FTP = W x 0.95 | Common field test |
| 30-minute test | Last 20-min W | LTP = W x 0.99 | Steady threshold |
| 60-minute best | Avg 60-min W | FTP = W | Race-like effort |
| CP pair | 3 and 12 min | CP from work slope | Power-duration model |
| Ramp test | Ramp FTP result | FTP with correction | Indoor testing |
| Rider Profile | Typical FTP | LTP Relation | Note |
|---|---|---|---|
| Diesel climber | High steady | LTP near FTP | Small sprint effect |
| Punchy racer | May test high | LTP lower | Short tests inflate |
| Triathlete | Stable output | LTP conservative | Aero position matters |
| New rider | Variable pacing | Broad range | Retest often |
| W/kg Range | General Class | Common Sign | Training Signal |
|---|---|---|---|
| <2.0 | Developing | Early fitness | Build consistency |
| 2.0-3.0 | Recreational | Group rides | Extend endurance |
| 3.0-4.0 | Trained | Strong local rider | Refine intervals |
| 4.0-5.0 | Advanced | Race capable | Target specificity |
| 5.0+ | Elite | High performance | Manage fatigue |
| Metric | Meaning | Formula Basis | Why It Helps |
|---|---|---|---|
| LTP | Lactate threshold power | Adjusted FTP/CP | Sustainable hard effort |
| FTP | Functional threshold power | Test-specific factor | Zone anchor |
| CP | Critical power | Two-effort slope | Model comparison |
| W prime | Anaerobic work capacity | Work above CP | Repeatability clue |
💡Tips
Cyclists obsess about their “max” power number, but above a brief hill-climb duration, that top number doesn’t really matter much at all. Lactate threshold power is how many watts a rider can produce without fatiguing his or her legs. It is the secret world of your fitness and the ceiling of sustained output. This is where our bodies changes from burning fuel aerobically (comfortably) to producing it anaerobically (strain). Knowing this limit divides the pack between those who blow up quickly versus those who stay strong while everyone else slows down.
Once you input your test results, the calculator above will crunch all the numbers for you, including figuring out what coefficient to use for each protocol. So no guessing required. You can either use a shorter duration (a 20 minute time trial) or couple it with a sustained effort (e.g., three minutes followed by 12), both of which yield a critical power estimate. And while both protocols give you insight into your work capacity, each tells a slightly different story. The short one is pretty hard-core, quick, and tends to overstate things if you go too hard off the line. Splitting up your work into two efforts (three minutes plus 12), for example, gives a better estimate of your true sustainable engine versus your empty supply of super-explosive stuff.
Why Lactate Threshold Is More Important Than Max Power
Riders frequently overlook one key: their own weight. Absolute watts indicate how hard you’re pushing, but watts per kilogram show how quickly you’ll be going uphill. Your body mass is automatically included in the calculation and provides a realistic classification. For example, an 80kg strong rider may generate higher absolute watts than a smaller climber, yet on a steep gradient, it’s all about the ratio for gravity. Check your weight input first if your figures seem off as this is the single biggest variable after power data.
Another factor they consider is fatigue. Chances are your test day wasn’t ideal and you weren’t running on fresh legs. The calculator accounts for how fresh you were on test day. It has you rate how heavy your training was and if you were racing fitly. If you run your test when fatigued, it will skew your estimate of the threshold lower. This results in overly conservative zones which restrict your performance. On the flip side, running your test fresh could give you a rosier picture but then fall flat during a race. Being honest about this pays better results over time than lying to yourself and thinking you’re feeling fresher than you actualy do.
Anaerobic repeatability also matters. Are you someone who can sustain a relatively consistent pace for hours at a time? Or do you have to deliver short, punchy efforts, but can’t keep it up for long periods? You can choose a rider profile and have the tool estimate a threshold that reflects these differences. Sprinters who use short, explosive efforts will probably have a functional threshold that is lower relative to their peak power than a climber’s. Failing to account for this characteristic will leave you feeling frustrated because your structured workouts don’t match your natural riding cadence.
After a good number, the zone table turns into your training map. Most volume should be in zone two: building the aerobic base that supports all else. It is easy, but it builds the mitochondrial density required for endurance. Then there’s zone four, right on the threshold, which can really crank up fitness gains from targeted intervals. The catch: spend enough time in low zones to fuel the high-intensity work, avoiding burnout.
If you’re riding easy and it’s feeling hard, drop the anchor and retest following a proper recovery block. Your zones are calibrated to how fit you are now, and should of been retested every four to eight weeks. To monitor changes, you don’t need fancy lab tests and blood draws. All you really need is one solid field test that you can repeat in similar conditions on a regular basis. That will give you all the information needed to dial up (or down) the training load to match.
It’s not about hunting for one magic number; it’s about understanding the nature of your engine and training it wisely. When you know your boundaries, you can also push them systemically and safely. So it’s all relative anyway at the end of the day. It’s a guideline. It also matters how you feel. Did you wake up feeling tired? Something isn’t right about your day or your data. Verify your inputs, trust the process and do what the result tells you to do next. You’re not in the perfect wattage sweet spot, you’re in the sweet spot of working towards being more efficient steady. This means the same steady rhythm you used to build your base will also take you through the work when it gets hard.