Lactate Threshold Pace Calculator
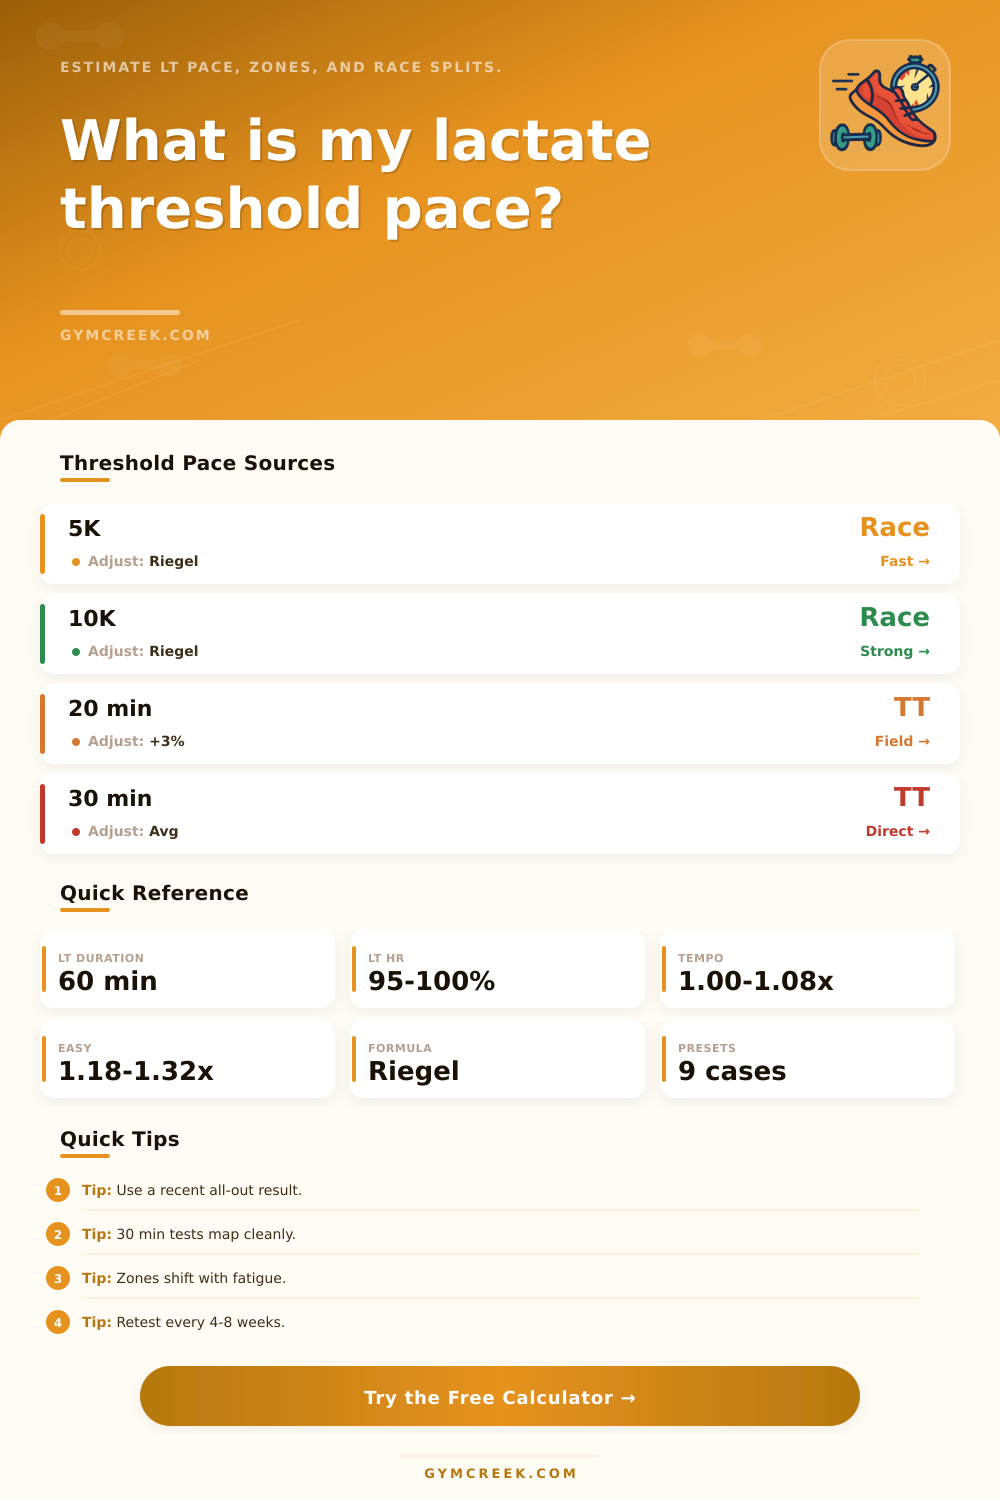
Estimate your one-hour threshold pace from a race, 20-minute time trial, or 30-minute field test, then map the result into running pace and heart-rate zones.
📌Presets
Presets load common race and field-test scenarios so you can compare how short races, longer races, and direct threshold tests change the estimate.
⚙Calculator
Threshold pace snapshot
Enter a race or time-trial result to estimate threshold pace.
📊Threshold Metrics Grid
📑Reference Tables
| Input Source | Best Use | Calculator Logic | Confidence |
|---|---|---|---|
| Recent 5K | Fast race fitness | Predict one-hour pace with Riegel exponent 1.06 | High if paced evenly |
| Recent 10K | Balanced threshold estimate | Convert race time to equivalent 60-minute speed | Very high for runners |
| 20-minute TT | Field test without a race | Add about 3 percent to average pace | Good with hard effort |
| 30-minute TT | Direct threshold test | Use average pace as the threshold anchor | Very high if solo |
| Pace Zone | Multiplier | Purpose | Feel |
|---|---|---|---|
| Recovery | 1.32-1.55 x LT | Regeneration | Very relaxed |
| Easy | 1.18-1.32 x LT | Aerobic volume | Conversational |
| Steady | 1.08-1.18 x LT | Endurance support | Controlled |
| Threshold | 0.97-1.03 x LT | Lactate clearance | Hard but stable |
| HR Zone | LTHR Percent | Use | Note |
|---|---|---|---|
| Zone 1 | Under 85% | Recovery | Keep pressure low |
| Zone 2 | 85-89% | Easy endurance | Daily aerobic work |
| Zone 3 | 90-94% | Steady running | Moderate strain |
| Zone 4 | 95-100% | Threshold | Race-like control |
| Race Result | Typical LT Pace | 60-Min Distance | Training Anchor |
|---|---|---|---|
| 25:00 5K | 5:26/km | 11.0 km | Beginner threshold |
| 50:00 10K | 5:04/km | 11.8 km | Club runner |
| 40:00 10K | 4:03/km | 14.8 km | Advanced aerobic |
| 18:00 5K | 3:55/km | 15.3 km | Competitive runner |
💡Tips
At some point in a run, your legs gets heavy and your lungs start burning. You might think it’s your lack of willpower or bad luck. In reality, it’s your lactate threshold; your body creating more lactate than it can remove. Your pace at that moment. Most runners just assume they know how fast it is. They go by some vague sense of effort that varies depending on the day (rainy days, stressed out days, tired days). Plug in a hard effort into calculator and let it do the math. Save yourself from guessing at your own body.
Picking the initial data point can be the tricky part. Pure endurance stability show up as a stable, thirty-minute time trial. Raw speed is reflected by, say, a five-kilometer race time. Because those fast races recruit fast-twitch fibers (which fatigue rapidly during sustained load), these two numbers is seldom identical. To convert races into pace, the tool use a Riegel exponent of 1.06. That takes into account the fact that you can’t maintain your top speed indefinitely. So if I want to guess what my hour-long pace would be based off a five-kilometer time, the model assumes that I’ll slow down somewhat.
How to Find Your Best Running Speed
So, presets include both steady field tests and fast races. Before locking in a training plan, you have to get a sense of how your speed converts from one distance to another. But now you’ve got an anchor… Your threshold, and it’s go-time.
But what good does knowing your number do? Running all miles at that pace are not so good. Most new runners assume slow running sucks and is boring. They cruise along nice and comfortabley in a moderate range, but it’s too soft to clear lactate and too hard to develop their aerobic capacity. That’s where the reference table on the page come in. It illustrates this nicely by showing you that easy runs must be far slower then your threshold pace. To create that bodily gap required for mitochondrial adaptation and recovery, you’ll want roughly one and a half times your threshold time per kilometer for easy work. You can’t sustain the fast stuff without that slow foundation.
People are different, and there is also this added level of complexity called heart rate zones. For example, two runners who run at the same threshold pace may has wildly differing max heart rates (or resting heart rates). You can enter your own average threshold heart rate into calculator. That’s typically found during a thirty minute threshold test (last 20 min). It’s better than relying on age-based, one-size-fits-all formulas. If you spike early in an effort, that could be a sign that you’re running too fast (not that your threshold is too low). When you use real-measured data, your zones will being grounded in reality (vs. The average of everyone).
Finally, remember that numbers alone don’t tell the whole story: A good race performance in scorching hot weather will be less indicative of your potential than one where everything lined up perfectly. Similarly, a killer day in a race could overstate how well you’ll do on an exhausting training cycle. That’s why the readiness adjustment comes into play. Again, a little detail, but details matter. This isn’t about figuring out pace; this is about modeling your fitness in certain conditions and then re-testing periodically so that those zones adjusts accordingly.
At the end of the day this stuff gets rid of the guess work in your workouts. You KNOW where your ceiling is. This lets you go harder because you know it’s okay. It also lets you relax more easy because you don’t have to feel guilty about it. A few seconds off every kilometer makes all the difference between targeting your training or trying to do random things. A few small moments turn into miles throughout the year. Do an honest hard effort out of the gate, let the tool figure out the zones, and then trust the process. You’ll know when you’re ready for a little bit more.