Isokinetic Strength Calculator
Estimate normalized peak torque, limb symmetry index, average power, fatigue index, total work, and speed-adjusted benchmark gap from an isokinetic dynamometer test.
📌Presets
Presets load realistic dynamometer scenarios and immediately recalculate torque, symmetry, work, power, and fatigue outputs.
⚙Calculator
Isokinetic strength snapshot
Enter your test values to estimate torque, symmetry, power, and fatigue.
📊Fitness Metrics Comparison Grid
📑Reference Tables
| Movement | Male Nm/kg Guide | Female Nm/kg Guide | Common Speed |
|---|---|---|---|
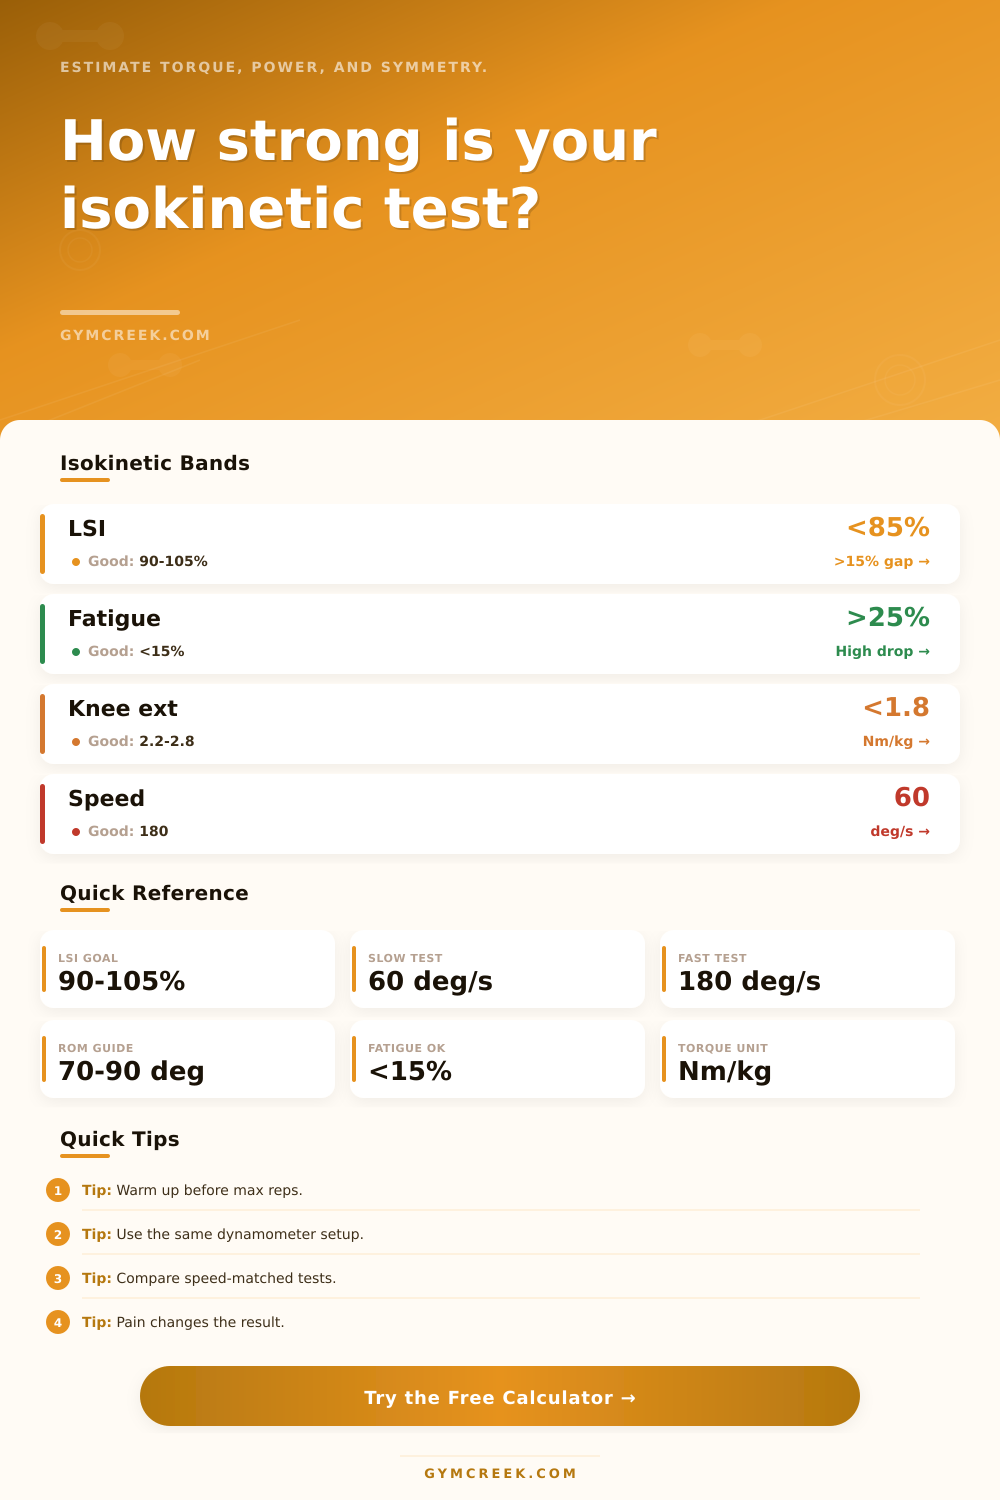
| Knee extension | 2.2-2.8 at 60°/s | 1.8-2.4 at 60°/s | 60°/s strength screen |
| Knee flexion | 1.2-1.8 at 60°/s | 1.0-1.5 at 60°/s | 60-180°/s hamstring profile |
| Shoulder external rotation | 0.38-0.55 at 60°/s | 0.32-0.46 at 60°/s | 60-180°/s shoulder screen |
| Shoulder internal rotation | 0.55-0.78 at 60°/s | 0.46-0.66 at 60°/s | 60-180°/s shoulder profile |
| Hip abduction | 1.35-1.85 at 60°/s | 1.10-1.55 at 60°/s | 60°/s hip strength screen |
| Ankle plantarflexion | 1.45-2.05 at 60°/s | 1.20-1.70 at 60°/s | 60-120°/s calf profile |
| Angular Velocity | Primary Use | Expected Torque | Interpretation Note |
|---|---|---|---|
| 30-60°/s | Max strength and peak torque | Highest torque output | Best for side-to-side strength deficits |
| 90-120°/s | Strength-speed blend | Moderate torque output | Useful for repeated clinical retesting |
| 180°/s | Power and sport-speed screen | Lower torque, higher power demand | Compare only with the same speed |
| 240-300°/s | Endurance and fatigue profile | Lowest peak torque | Watch rep quality and stabilization |
| Metric | Strong Band | Caution Band | Retest Flag |
|---|---|---|---|
| Limb symmetry index | 90-105% | 85-89% or 106-115% | Less than 85% or more than 115% |
| Fatigue index | 0-15% | 16-25% | More than 25% |
| Torque deficit | Within 10% of benchmark | 10-20% below benchmark | More than 20% below benchmark |
| Pain or guarding | 0-2 of 10 | 3-4 of 10 | 5 of 10 or higher |
| Formula | Variables | Output | Use |
|---|---|---|---|
| Normalized torque | Peak torque Nm / body mass kg | Nm/kg | Compares athletes of different sizes |
| Limb symmetry index | Involved torque / uninvolved torque x 100 | Percent | Side-to-side deficit estimate |
| Mechanical work | Average torque x ROM radians x reps | Joules | Approximate output across repetitions |
| Average power | Total work / total contraction time | Watts | Speed-specific performance estimate |
| Fatigue index | (First-third torque - last-third torque) / first-third torque x 100 | Percent drop | Repeated-effort strength endurance |
| Scenario | Useful Focus | Typical Flag | Retest Control |
|---|---|---|---|
| ACL return-to-sport knee extension | LSI, Nm/kg, torque deficit | Quadriceps LSI below 90% | Same seat, pad, and gravity correction |
| Hamstring sprint screen | Knee flexion at 60 and 180°/s | Fast-speed drop or side gap | Match hip angle and warm-up |
| Throwing shoulder profile | External/internal rotation balance | ER torque lag or pain rating | Same scapular plane and ROM limit |
| Post-fatigue retest | Fatigue index and total work | Large torque drop across reps | Consistent rest before trial |
💡Testing Tips
By plugging in some scattered dynamometer results to the calculator we built (above), you can get a coherent snapshot of joint health. It handles the conversions and comparisons for you, letting you concentrate on interpreting the data for upcoming training.
Strength testing isn’t simply about raw force production. You should also considers endurance, symmetry, and the ability to produce that same force while fatigued.
How to Read Your Strength Data Correctly
Peak torque (the highest amount of force produced anywhere along the path of motion) is what most people focus on as the end all be all. It’s just part of the equation though, and it can result in some athletes producing a ton of force as a singular occurrence but not having the ability to sustain it throughout a full season. The tool normalizes that peak torque with bodyweight, resulting in a ratio, so you’re able to compare apples to apples between two athlete or even the same athlete over time if they’ve lost/gained a bunch of weight. That adjustment is important because a larger athlete naturaly produces more total torque from their mass which can hide weakness in relation to their own body.
Another place our gut feelings let us down is with limb symmetry. We think it’s got to be totally symmetrical, but humans aren’t built to have perfect symmetries; the real danger is actualy large deficits or the injured side being significantly stronger. The real danger lies in large deficits or when the injured side appears significantly stronger than the healthy one. That chart on the page spells that out pretty well, there will always be some asymmetry. What can cause problems is having too much difference in strength or having the affected side so strong compared to the unaffected side. That tends to mean you’re not recovered, but instead compensating for something else. If you want to know whether it’s systemic weakness or localized, then you’ve got to compare both sides and see how they stack up.
For athletes doing multiple reps at maximum effort, not only is peak force important, but so is fatigue index. Fatigue index measures the loss of torque from the first third of your repetitions to the last third. So if it drops off dramatically, then even though you might be able to fire like gangbusters at the beginning of the rep, you don’t have the endurance to keep going once you’re tired. That’s especially true with contact sports like basketball or soccer where you’ll sprint and cut again and again during a match. As you get weaker toward the end of the rep, you are more likely to sustain a non-contact injury after your stabilizing systems gives out.
Another common oversight in a quick evaluation is testing speed, which adds an additional level of complexity. Slow testing speeds, typically around 60 degrees/second, will highlight pure maximal strength capabilities; while faster speeds closer to 180 degrees/second will favor power and explosiveness. Because of the force-velocity curve, you can’t directly compare tests done at varying speeds (since torque declines with increasing speed). Using the presets within the calculator helps assign relevant benchmarks based off movement types (e.g., thrower’s shoulder rotation, ACL return-to-sport knee extension).
You’d be surprised at how skewed your findings will become with pain or guarding. Torque measurements can actualy be artificially lower if you’re testing with any kind of pain, as your nervous system protects the joint by stopping muscle recruitment. A readiness score that accounts for pain ratings helps contextualize these numbers. Even if the raw torque is impressive, high force output paired with high pain is a red flag. This means the tissue isn’t quite ready for full load.
This analysis isn’t meant to spit out data points; it’s intended to help make smart decisions. Have I regained enough strength to sustain my activity level in a safe and even manner? Normalizing your torque data alongside other metrics like symmetry, fatigue resistance, and pain levels helps you know when you’re ready. No single piece of data can provide that same insight on its own. In the end, strength is more than a measure of output; it’s about how your body reacts to demand over time and under pressure.