Internal Load Calculator
Blend heart-rate zone minutes, session RPE, TRIMP-like strain, duration, athlete sex, fitness level, sport type, and recovery status into one practical training load profile.
📌Training Load Presets
Presets fill a full scenario. Adjust the zone minutes, RPE, and recovery fields to match the session you actually completed.
⚙Calculator Inputs
Internal load snapshot
Enter HR zone minutes, RPE, duration, sport, and recovery details to estimate session strain.
📊Internal Load Metrics Grid
📑Reference Tables
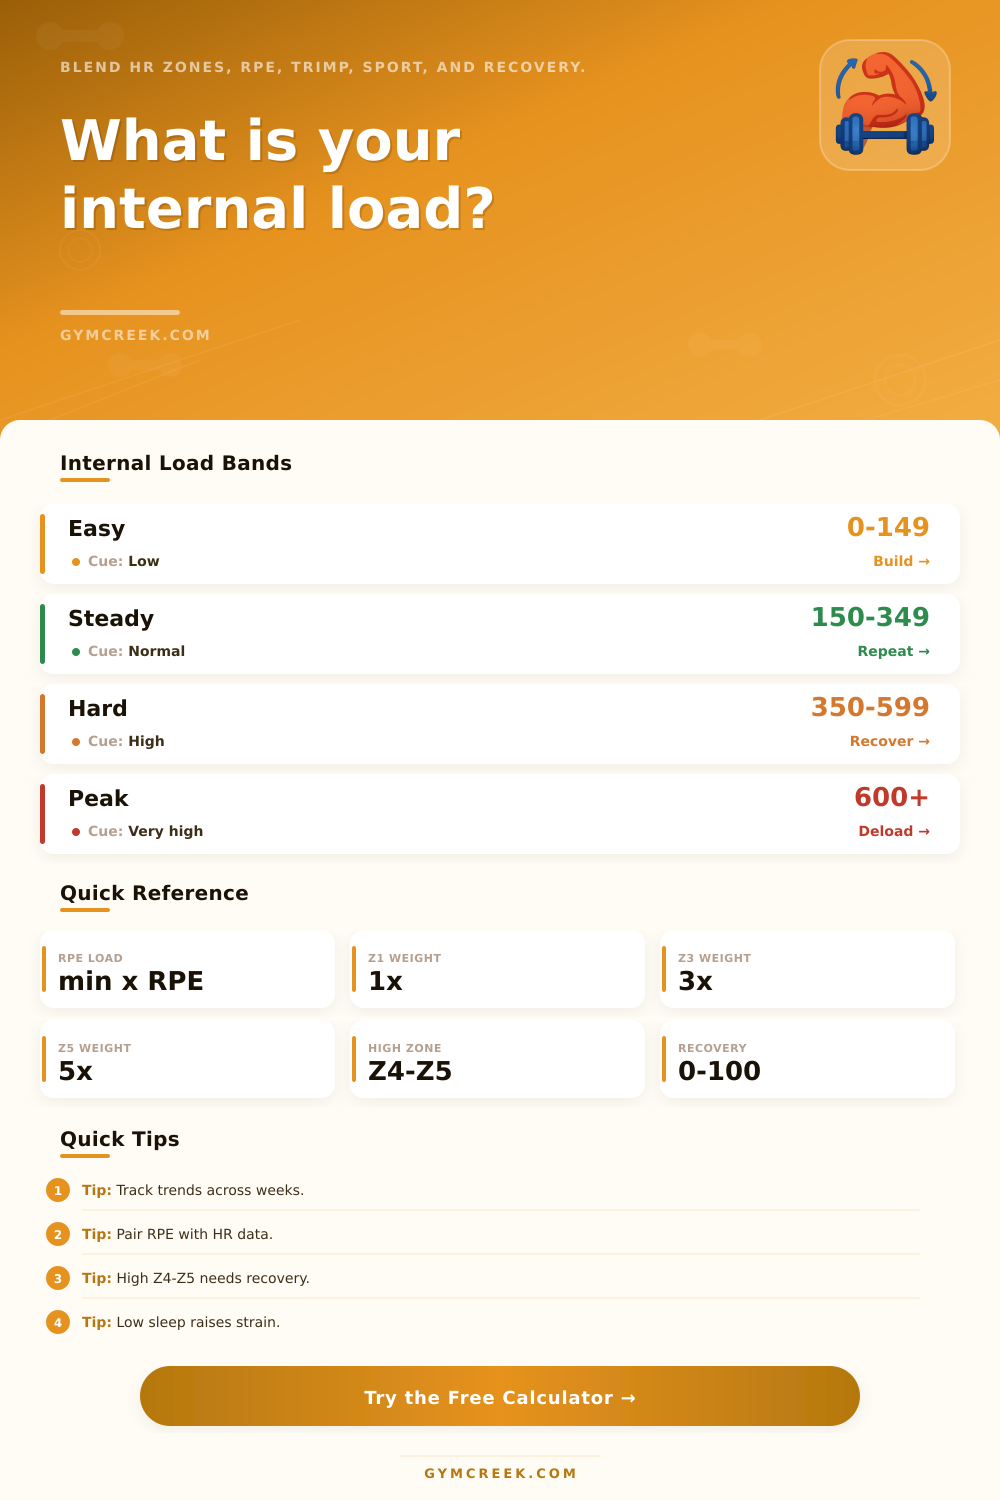
| Internal Load Band | Score Range | Session Meaning | Recovery Cue |
|---|---|---|---|
| Easy | 0-149 | Low strain or recovery work | Normal training can continue |
| Steady | 150-349 | Useful aerobic or mixed stimulus | Repeat if readiness stays high |
| Hard | 350-599 | High stress training day | Place easier work next |
| Peak | 600+ | Race, long event, or major spike | Deload or restore first |
| HR Zone | Percent HRmax | Load Weight | Typical Use |
|---|---|---|---|
| Zone 1 | 50-60% | 1 per minute | Recovery, warm-up, cool-down |
| Zone 2 | 60-70% | 2 per minute | Base endurance and easy volume |
| Zone 3 | 70-80% | 3 per minute | Steady tempo or moderate work |
| Zone 4 | 80-90% | 4 per minute | Threshold and sustained intervals |
| Zone 5 | 90-100% | 5 per minute | VO2, sprint, and race surges |
| Sport Factor | Multiplier | Why It Changes | Watch Point |
|---|---|---|---|
| Run | 1.08 | Impact and eccentric stress | Leg soreness after hard days |
| Cycling | 0.94 | Lower impact, high volume tolerance | Long duration still accumulates |
| Swimming | 0.90 | Supported body weight | Shoulder fatigue and technique |
| Field or court | 1.12 | Surges, cuts, contacts, pauses | High neuromuscular cost |
| Strength conditioning | 1.05 | Muscular damage plus effort | RPE may exceed HR signal |
| Recovery Status | Readiness Score | Load Response | Practical Choice |
|---|---|---|---|
| Ready | 80-100 | Normal tolerance | Progress if warm-up is smooth |
| Manage | 60-79 | Slightly amplified strain | Hold the plan or reduce finishers |
| Caution | 40-59 | Meaningful recovery penalty | Trim intensity or duration |
| Low | 0-39 | Large recovery penalty | Technique, recovery, or rest |
💡Internal Load Tips
The core of training decisions lies in internal load. Did I just go fast enough? Did I go far enough? How does it feel, hard? If so, did I pay too high a price to achieve it, and when might I demand something similar from my body again?
It’s not always found in miles and paces. It’s found where perceived effort, heart rate, recovery readiness, fitness level, and the demands of sport meet. These factors comes together to create one actionable cue. That’s what most athletes are trying to capture with their data: bits of that image. Log in some number of minutes in this zone, record the RPE later, etc. But none of these numbers, alone, will ever paint the whole picture.
How to Measure Your Training Load Correctly
You might have a short threshold workout and a long easy run. You may spend nearly the same amount of time in a given heart rate zone but one leaves you feeling fresher than the other. This is because the neuromuscular demand and muscular cost is different.
Enter those things. Duration, RPE for that session, zone minutes, sport, recovery score, and fitness level, into calculator above. It will spare you from having to guess how all those inputs weigh against one another. The inputs aren’t just arbitrary dials; they represent something real in the world. Heart rate reserve changes by body (e.g., age, sex) to shape the TRIMP-like curve. The tolerance threshold change with fitness level. A conditioned runner will endure a higher absolute load before they registers the same strain rating.
And sport type is a factor too: Swimming and cycling spread out the load compared to running, which has eccentric and impact stresses. Then there’s recovery readiness, a 0-100 score that includes all those variables typically missed by numbers (soreness), sleep quality, HRV, and stress. A lower score mean a bigger penalty for same session.
The tool gives you both an overall internal load figure and a recovery cue… What to do next. The latter is more important than the raw number. Even though it may have seemed modest on paper, back-to-back hard days without enough spacing will show up as high strain. By folding-in the recent week’s load and days since your previous hard effort, the calculator flag this pattern. It also shows monotony, or the risk of repetitive similar demands without enough contrast.
When individuals mistake internal load for THE answer, they makes common errors. They chase lower numbers despite needing more stimulus, or they ignore the difference between what their body feel and what their watch recorded. A low heart rate/high RPE likely doesn’t reflect faulty data but instead accumulated fatigue, heat or dehydration. Low heart-rate time but high RPE indicates that what you thought would be intense remained aerobic. When combined, both provides useful information.
But with no formula to remember, the page breaks down into a set of reference tables, such as Zone weights and Load Bands, where you can put your value in context. Easy sessions sits low and allow normal training to continue. Steady days repeat well when recovery stays solid. Higher cost & deliberate space required after hard and peak sessions.
Decision bands are not a ranking of how good an athlete you are. The overall pattern is much more important over time than any individual session. When do the hard ones group together? How well are recovery weeks working? Are they really reducing load sufficiently? When does something external (illness, injury, life stress, travel) elevate what would otherwise be a normal session? With the calculator, you have an unbiased way of seeing this shift, with no need for perfect recall.
This isn’t about perfection. This is about getting something slightly more precise than a “guess.” That is enough to prevent you from making stupid mistakes and ensure training continues for months instead of weeks. You should of used the calculator sooner to avoid accumulatted fatigue. It’s better than guessing based off how you feel naturaly.