Indoor Cycling Distance Calculator
Estimate spin bike distance, average speed, calories, flywheel revolutions, watts, training load, FTP share, and class distance from cadence, resistance, power, time, and bike calibration.
📌Indoor Ride Presets
Presets model common indoor rides. Distance is an estimate because studio bikes use different resistance curves, flywheel math, and console calibration.
⚙Rider and Bike Inputs
Indoor cycling distance snapshot
Enter ride time, cadence, resistance, power, and bike profile to estimate indoor cycling distance.
📊Indoor Cycling Metrics Grid
📑Reference Tables
| Ride Type | Time | Typical Cadence | Estimated Distance |
|---|---|---|---|
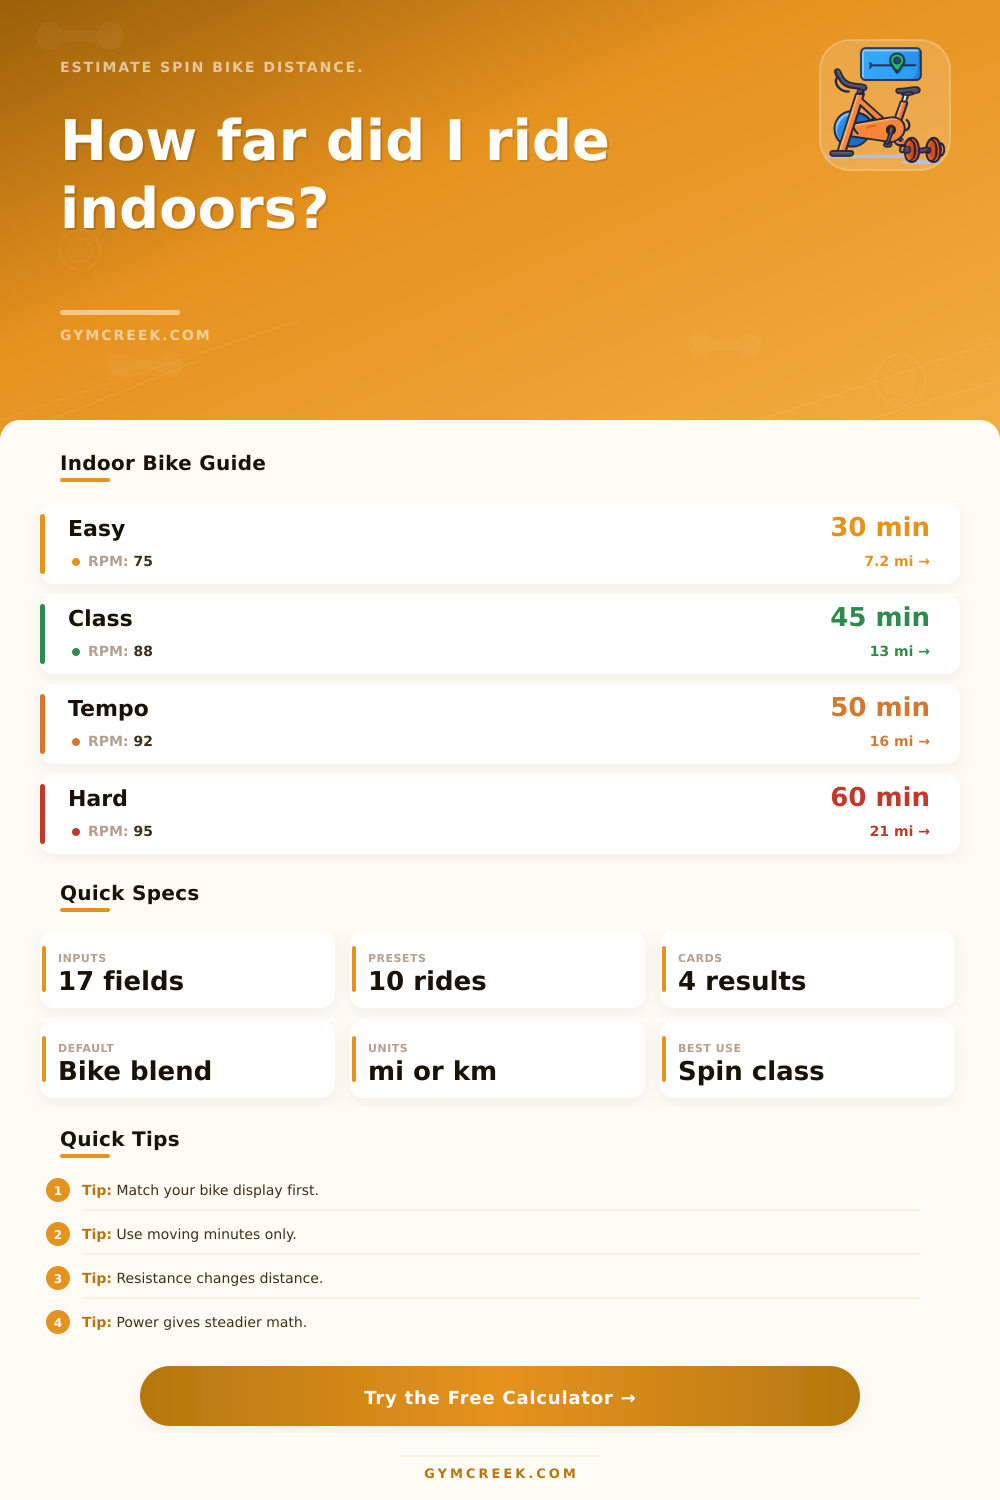
| Recovery spin | 30 min | 65-80 rpm | 5-8 miles |
| Studio class | 45 min | 80-95 rpm | 10-15 miles |
| Endurance ride | 60 min | 82-95 rpm | 16-22 miles |
| Power interval ride | 40 min | 85-105 rpm | 11-17 miles |
| Method | Best Input | Strength | Watch Point |
|---|---|---|---|
| Bike blend | RPM, resistance, watts | Balanced estimate | Needs realistic inputs |
| Cadence | RPM and gear ratio | Transparent math | Virtual gearing varies |
| Power speed | Average watts | Repeatable load | Indoor speed is virtual |
| Console correction | Bike distance | Matches display | Console may drift |
| Signal | Easy | Moderate | Hard |
|---|---|---|---|
| Cadence | 60-75 rpm | 76-95 rpm | 96+ rpm |
| Resistance | 15-30 | 31-55 | 56+ |
| RPE | 2-4 | 5-7 | 8-10 |
| FTP share | Under 60% | 60-85% | 86%+ |
| Formula Piece | Variables | Result | Use |
|---|---|---|---|
| Cadence distance | RPM, gear, wheel | virtual miles | Bike mechanics |
| Power speed | watts, weight | virtual mph | Power context |
| MET calories | MET, kg, min | kcal | Energy estimate |
| Mifflin-St Jeor | age, kg, cm, sex | BMR | Daily context |
💡Indoor Distance Tips
At first, logging your indoor cycling distance seems like an imaginary figure: How could anyone track real-world mileage on a machine that doesn’t even move? But then you realize those miles (or kilometers) being displayed on the screen aren’t just random: They’re what determine whether your week’s goal is met and inform the training plan itself.
Each studio’s bike convert your pedal strokes to distance different than based off its own calibration of resistance curve, wheel size and more. Where most folks fall off the thread is that space in between reported versus reality, which is that some bikes favors fast cadence with plenty of distance, while others credit a consistent output of resistance with less. In the same class, two cyclist could get identical times but wildly differing readings on their displays, and it isn’t make believe. It’s due to math performed by each device converting wheel rotations into speed.
Why Indoor Cycling Numbers Are Different
That’s a lot of words but it all boils down to this: figure out what number you really want your number to be, and if you’re going to use it for anything other than comparison between rides on the same bike then consistency trumps exactness. If you want to know how hard it would feel on the road, realize that indoor resistance seldom reflects wind resistance or rolling resistance. From there the trick is knowing which input numbers impact result and which are just contextual.
That’s where calculator comes in. It does math when you put in bike type, power, resistance, and cadence. Resistance is how much the flywheel fights back. Cadence is how fast the pedals turn. Power is the best indicator of your workout since it measures what you’re actualy doing versus letting the bike do the math inside. You can add your weight so that the tool can estimates watts per kilogram, while ride style and calibration settings adjusts for how different classes and machines report distance.
Cadence is how fast pedals go around. Some people use last number as their score, and while I get it, that gets tricky as you swap out bikes, change consoles, etc. Instead, I think it’s best to look at the in/out relationships on an ongoing basis… I.e., have you seen your average power remain constant yet see estimate decrease? If yes, maybe youve changed your cadence patterns or resistance settings and that shows up as a pattern rather than a single-mile data point.
The same holds true for weekly volume tracking: The tool calculate the number of times you repeat similar rides and multiplies it by total distance. You get an idea of training load without needing to map out a ride in the outdoors, and estimated calories follow suit: It scales to body weight and power via metabolic equivalents. Are these estimates? Yes. But they is useful if the inputs remain consistent week after week.
Once you stop running for the largest number you get and instead treat it as just another piece of information, you will see where the real value is. You are still working hard in your lungs and legs. And the calculator just helps to put those feelings into something you can measure and compare with what you would of want to achieve.