Incline Percentage to Angle Calculator
Convert treadmill grade percent, ramp rise and run, or angle in degrees into practical incline metrics, climb gain, effort context, and calibration-friendly reference values.
📌Incline Presets
Presets fill realistic treadmill, route, ramp, and trail scenarios. Change any value to convert between incline percent, angle, rise, run, and climb demand.
⚙Incline Inputs
Incline snapshot
Enter grade, angle, or rise and run to convert incline measurements.
📊Incline Metrics Grid
📑Reference Tables
| Grade | Angle | Rise per 100 ft | Fitness Context |
|---|---|---|---|
| 0% | 0.00 deg | 0 ft | Flat baseline or treadmill warmup |
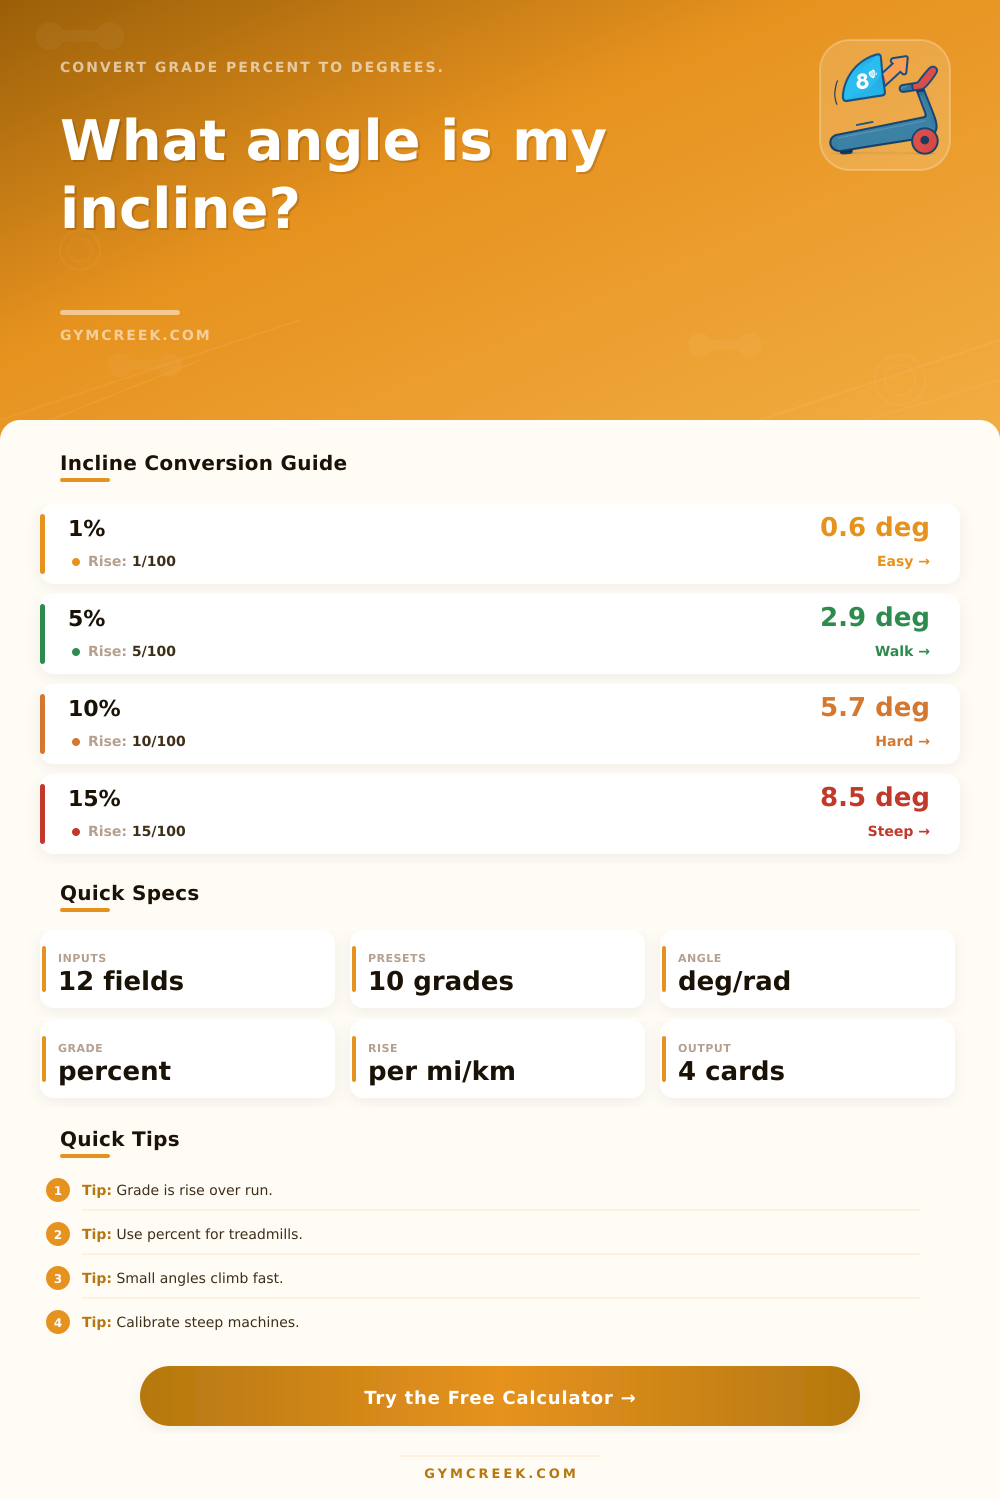
| 1% | 0.57 deg | 1 ft | Outdoor wind-cost approximation |
| 5% | 2.86 deg | 5 ft | Moderate hill walking |
| 10% | 5.71 deg | 10 ft | Hard treadmill climb for many users |
| 15% | 8.53 deg | 15 ft | Steep walking and hiking practice |
| Metric | Formula | Uses | Note |
|---|---|---|---|
| Grade percent | rise / run x 100 | Rise and horizontal run | Percent is not the same as degrees |
| Angle degrees | atan(grade / 100) | Grade percent | Converts slope ratio to angle |
| Radians | degrees x pi / 180 | Angle degrees | Useful for math and engineering |
| Vertical gain | distance x grade | Workout distance | Uses horizontal distance approximation |
| Walking VO2 | 0.1 speed + 1.8 speed grade + 3.5 | Speed and incline | ACSM walking equation context |
| Scenario | Typical Grade | Conversion Need | Watch Point |
|---|---|---|---|
| Treadmill easy walk | 1% to 3% | Compare incline settings | Confirm belt speed and posture |
| Brisk hill walk | 4% to 8% | Translate route climb to treadmill | Do not hold rails for the test |
| Steep climb session | 10% to 15% | Find true angle and rise rate | Progress calves and Achilles slowly |
| Ramp measurement | Variable | Check rise over run | Measure horizontal run carefully |
| Loaded ruck | 2% to 10% | Add load context to grade | Footwear and descent matter |
| Band | Grade Range | Angle Range | Practical Meaning |
|---|---|---|---|
| Flat | -0.5% to 0.5% | About 0 deg | Baseline movement or calibration check |
| Gentle | 0.6% to 3% | 0.3 to 1.7 deg | Small but measurable incline |
| Moderate | 3.1% to 7% | 1.8 to 4.0 deg | Noticeable hill effort |
| Steep | 7.1% to 12% | 4.1 to 6.8 deg | Strong climbing stimulus |
| Very steep | 12%+ | 6.8 deg+ | High demand for walking workouts |
💡Incline Calculation Tips
Slope is expressed as percent grade and as degrees. A percent grade give you a ratio of elevation gained per unit of distance. A degree describes the literal angle your body has to work against. While these two number both describe the same slope, when on the move, one feels different than the other.
To enter data into the calculator (above), select which method to use. Begin with the percent grade from a treadmill display, perhaps, or the angle that was measured on your phone, or simply the rise over run of a ramp. From there, the calculator do the rest. It will return the matching degree of angle and the corrected grade based off your calibration offset. Additionally, it’ll provide an estimated vertical gain during a specified length workout.
Understanding Slope and Effort
It even accounts for speed, body weight, and any load being carried to give you an estimate of effort according to standard walking equation. That number exists because small changes in grade make big changes in how hard something is physically. If the ground’s 3 percent slope, and if you walk across it comfortabley, it’ll feel like just a gentle nudge. Walk the same pace up a 10-percent grade, though, and you’re suddenly dealing with some serious climb-stimulus.
And here’s where the calculator shines: You don’t need to know any formulas to see the tradeoffs involved. Many folks believe that if they measure actual sloping surface, then they’ve got a good handle on grade. They don’t. To get the right answer, you must use horizontal run (not the tape running along the incline). On gentle slopes, the difference between these two measures is small. As you increase angle, however, that difference gets bigger fast. That’s why the tool separate out horizontal distance.
In real life, clean numbers on a screen don’t correspond to real routes. Fatigue, wind, the effect of a climb followed by a downhill, and the feel of a surface make an incline feel different. No math formula can accounts for every variable. But having a dependable baseline to adjust on the fly is key.
If your usual loop’s 6 percent hill feels steeper than the number says today, you’ll know it’s not because your grade calculation was wrong. Instead, it might of be time to check your hydration, temperature, or overall fatigue. And the numbers’ meanings shift depending on purpose. What is a 12 percent grade? It’s something to power up on the treadmill deliberately as part of a training session, and it’s something to avoid around as best as possible during a recovery walk.
The activity level and goal choices in this tool will help shape that context without altering the underlying conversion. Treat incline as information, not a target. That’s the most useful habit.
You can use that tool pre-event for a ramp. You can convert a trail profile into a treadmill session. Or, you can determine how much more demand is placed on a known grade with an additional load. It’s all the same math. It just is a different decision.