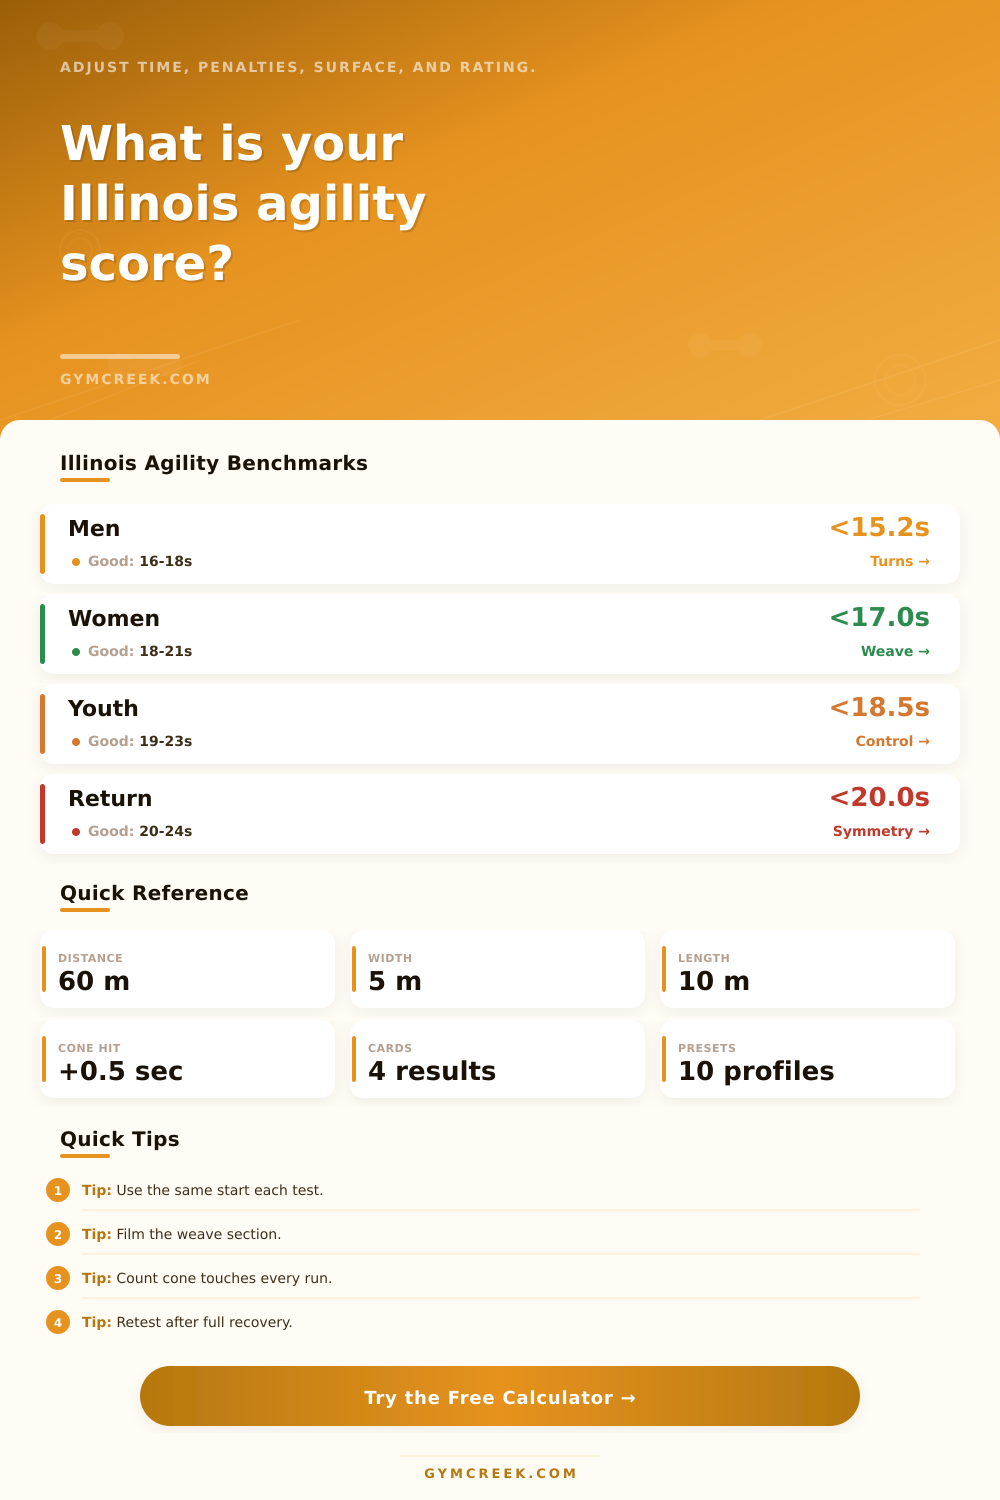
Illinois Agility Test Calculator
Adjust an Illinois agility test time for timing method, surface, start style, cone penalties, and turning quality, then compare speed, change-of-direction load, and benchmark rating.
📌Presets
Each preset loads realistic body size, test conditions, penalties, and turning quality so the live result cards update immediately.
⚙Calculator
Illinois agility test snapshot
Enter a valid test time and course setup to calculate adjusted agility metrics.
📊Agility Metrics Grid
🧮Formula Cards
📑Reference Tables
| Group | Excellent | Good | Development Focus |
|---|---|---|---|
| Men / open field sport | Under 15.2 sec | 15.2–17.0 sec | Braking and re-acceleration |
| Women / open field sport | Under 17.0 sec | 17.0–19.5 sec | Weave rhythm and exit speed |
| Youth athlete | Under 18.5 sec | 18.5–21.5 sec | Control before speed |
| Return-to-play athlete | Under 20.0 sec | 20.0–23.0 sec | Side-to-side confidence |
| Course Part | Distance | What It Shows | Common Time Loss |
|---|---|---|---|
| Prone start to line | 10 m | Start reaction and first drive | Late push or poor stance |
| Return sprint | 10 m | Braking and turn angle | Overstriding into the line |
| Central weave | 20 m pattern | Hip control and foot placement | Wide cone paths |
| Final sprint home | 10 m | Exit speed under fatigue | Slow re-acceleration |
| Correction | Calculator Add | Best Use | Caution |
|---|---|---|---|
| Electronic gates | 0.00 sec | Best comparison setup | Gate height matters |
| Hand timed | 0.24 sec | Informal team testing | Reaction bias is large |
| Cone touch | 0.50 sec each | Course discipline | Count every contact |
| Heavy grass | 0.65 sec | Field estimate | Surface effect varies |
| Formula | Variables | Result | Use |
|---|---|---|---|
| Adjusted time | raw plus adders | sec | Neutral comparison |
| Average speed | 60 m / time | m/s, mph, kph | Overall course pace |
| Weave estimate | time x 0.42 | sec | Middle cone demand |
| Load index | time x kg / 100 | score | Mass-aware comparison |
💡Tips
A lot of athletes think all they need is their raw stopwatch time, and that’s never true. What they don’t realize is much of the difference between a sloppy start and a legitimate speed deficit isn’t visible with naked eye; it matters a lot in your development.
Running the Illinois Agility Test not only measure your change of direction, but also your technique, patience and a bit of luck on the environment. If you’re treating one number as if it’s absolute truth, you’ll waste training sessions because you have no idea how to translate what that clock actualy registered.
Why Raw Times Are Not Enough
It sounds easy, but course isn’t. You lie down, get up and run a short distance; then you weave through some cones, slow down, turn around, go fast and cross the finish line. It require balance. You must turn from full speed to a dead stop and back to full speed at any moment, all while slowing quickly and changing direction.
The key is knowing what’s really being tested (is this more of a speed event or a controlling-speed event?). The calculator takes thinking out of the equation by letting you enter your conditions and doing the rest. The math converts and corrects your performance based off various factors, such as timing device used and the type of ground surface. This allows it to normalize your result with a consistent baseline.
Agility is also greatly affected by surface conditions; It’s not like running your feet down a hard court versus pulling them through thick grass. This is where the tool steps in. It calculates an estimate of drag caused by wet fields, turf, etc. It adjusts for that.
So if one player runs the test on a wet day (say a rainy Thursday) and another does on a dry day (let’s say a sunny Tuesday), they won’t compare as fast. That’s why some folks miss the mark on this…apples vs oranges. They assume the player isn’t doing well when realy it was the field condition. The reference table on the page lays out this adjustment clearly so you can see how much a perfect run can be stolen from by a heavy surface.
The surface you stand on is important, so is how you time yourself. Hand timing is subjective, and electronic gates are accurate. However, there’s always some human reaction involved when you’re hand timed. This adds a few tenths of a second and can skew test results. These tenths will add up over several tests and give you a false sense of what’s going on. To even out the playing field, the calculator adjust manually timed tests with an industry-standard amount.
It also takes into account starting style. When you start from a prone position, you have to generate more momentum at the beginning than if you started in a standing position. If this variable isn’t accounted for, then athletes starting in various ways cannot be compared against each other.
And then there’s the turn itself. You can get really fast, but speed means nothing if you hit the cones. That doesn’t matter. With this tool, you can program a penalty for hitting the cones, going too wide on a turn, etc. That matters because it distinguishes between pure speed vs. Technical efficiency. An athlete may well be fast but when he gets out wide at the weaves his actual run has more distance than it should of. This masks his actual potential, and the result gives you a technical and physical target to aim for.
These results are benchmarked. It is nice to know how you compare to general population by comparing your time against general standards. However, that is only half of the story. The beauty is in long-term comparisons. It is one thing to tick off a box on the test day but another to see your adjusted times get better over the course of months. The reference chart has ranges. Development, good, elite, for youth, women and men. Those are meant as a guide, not gospel. If used well, they can tell you whether someone requires additional technical drilling or more strength work.
Another hidden variable is resting time in between trials. True ability is masked by fatigue. An athlete’s numbers will be lower if they are tested after long practice session because their legs are tired, not because they lack agility. The calculator prompts you to record rest times to factor in fatigue effects. This makes the best trial show maximum capability instead of endurance limitations. It is a small thing, but it is important because it allows for a fair evaluation of the nervous system‘s response with proper recovery.
Agility comes from speed, strength, and coordination. Agility is nuanced. How does it manifest on a crazy field? How do we test that? There is not just one way. However, a good test gives us a solid look at what an athlete looks like in action. A good test takes away all the stuff you have no control over: sloppy start? The surface might be bad. The timing was poor. It removes the noise from the results. And now you see someone’s true performance.
Being fast isn’t enough. It has to be consistent, under pressure. And that’s where you get that clarity, by taking away things you don’t have any control over. Apply the results to targeted practice. Focus on braking if your adjusted time remains elevated. Practice turning tighter if your raw time is good but your adjusted one suffers. Apply these numbers as guides to what to work on next. Don’t go for the clock alone. Go for the efficiency within it.
Most folks don’t pay attention to those little things. They make all the difference between good and great. Get the cones up close. Trust the adjustments. Run the course again with a new form. That’s how you make real progress.