High Intensity Interval Training Calories Burned Calculator
Estimate HIIT calories from body weight, work intervals, rest structure, exercise METs, set breaks, and afterburn from EPOC.
📌HIIT Presets
Presets load realistic work intervals, rest intervals, rounds, effort, and EPOC assumptions, then calculate immediately.
⚙Workout Inputs
HIIT calorie snapshot
Enter work, rest, rounds, body weight, and intensity to estimate workout calories.
📊HIIT Metrics Grid
📑Reference Tables
| HIIT Style | Base MET | Typical Work | Best Use |
|---|---|---|---|
| Low-impact intervals | 6.2 MET | 30-60 sec | Entry conditioning |
| Bodyweight circuit | 8.5 MET | 30-45 sec | General HIIT |
| Bike erg or spin | 9.8 MET | 15-60 sec | Power output |
| Rowing intervals | 10.2 MET | 30-90 sec | Full-body cardio |
| Running sprints | 12.4 MET | 10-45 sec | Speed work |
| Kettlebell circuit | 10.8 MET | 20-60 sec | Strength endurance |
| Work:Rest | Density | EPOC Range | Training Feel |
|---|---|---|---|
| 1:4 | Power | 3-7% | More recovery |
| 1:2 | Hard | 5-9% | Sprint repeat |
| 1:1 | Dense | 7-12% | Classic HIIT |
| 2:1 | Very dense | 9-14% | Metcon style |
| Tabata | Max density | 10-16% | Short and severe |
| Formula | Variables | Use | Output |
|---|---|---|---|
| Work kcal | MET x kg x hr | Hard intervals | Calories |
| Rest kcal | Rest MET x kg x hr | Recoveries | Calories |
| Net kcal | (MET - 1) x kg x hr | Training load | Calories |
| EPOC kcal | Net x percent | Afterburn | Calories |
| BMR | Mifflin-St Jeor | Daily context | kcal/day |
| Scenario | Rounds | Work Pattern | Expected Burn |
|---|---|---|---|
| Beginner low impact | 8-12 | 30s on 30s off | Low-moderate |
| Tabata finisher | 8 | 20s on 10s off | Short high rate |
| Circuit HIIT | 10-20 | 40s on 20s off | Moderate-high |
| Sprint repeats | 6-12 | 20s on 90s off | Power focused |
| AMRAP metcon | 15-25 | 45s on 15s off | High density |
💡Tips
I bet someone has told you that high-intensity interval training is better for burning more calories per minute than steady-state cardio. Technicly yes. If we’re talking one minute. But here’s where things get tricky: If you examine the entire session, HIIT isn’t necessarily all sweat harder, less time; it’s also about balancing the tradeoff between how hard your body is working vs. How much gas you have left to complete the workout.
Why does this matter? Most of us think we can do more then we actualy can, so we quit after two weeks of bad session. Plug in your intensity, rest period, and work interval into the calculator above, and it’ll do all the math for you. No need to guess at your actual energy output. It also distinguishes between net and gross calories, which most fitness tracker lump together as one total.
Why Net Calories Are Better for Weight Loss
Gross calories account for every calorie you expend throughout your workout. Your body’s baseline energy requirements just to be alive. Net calories remove that resting metabolism component to reveal the true cost of the exercise itself. For anyone looking to create a caloric deficit for fat loss, net calories is the more honest number here. They’ll tell you exactly how many calories you spent on top of your day-to-day expenditure, not the calories you’d have burnt while sitting on couch.
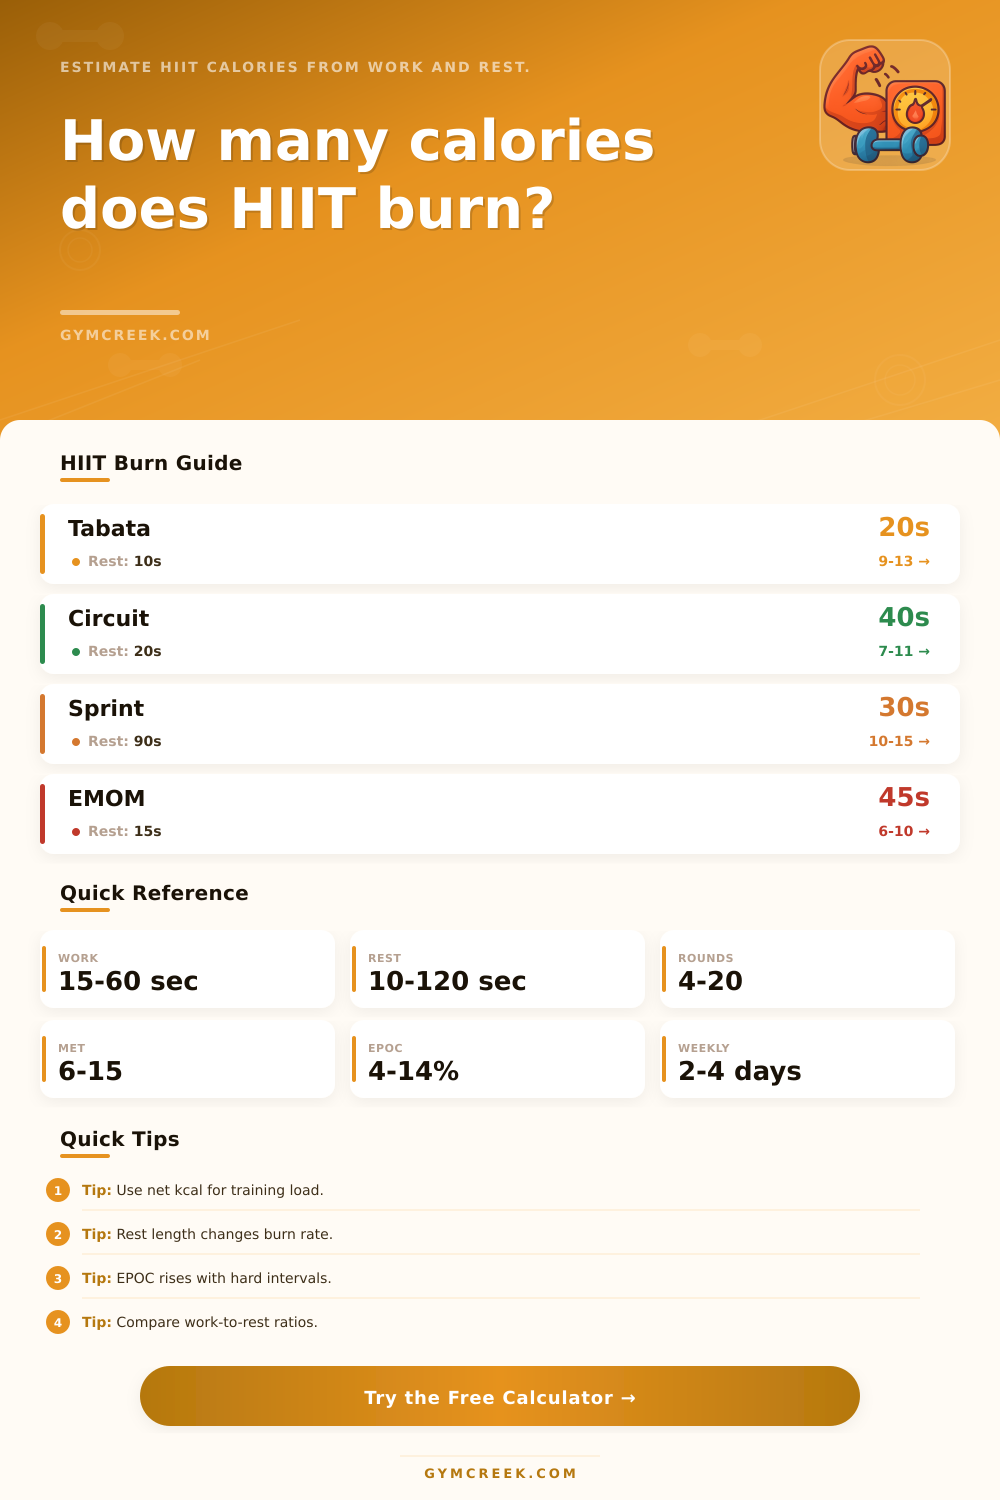
That’s reflected in the input on this tool: it has fields for rest periods and work intervals, i.e., how structured your workout is. If you’re doing 40 seconds of work and 20 seconds off, your calorie burn will be much different than if you’re doing 20 seconds of work with 10 seconds of rest. The lower the ratio, the greater level of sustained intensity you can get… But also the sooner your form is likely to deteriorate compared to exhaustion. To allow for this, the calculator requests an effort rating so that metabolic equivalent can be adjusted.
Even though it may look like the same amount of time, sprinting full-out burns way more calories than jogging briskly ever could. Most folks rate their efforts as max when they actualy just mean uncomfortable. That difference make a huge difference in total output. And then there’s EPOC (or the afterburn effect). Your body use additional oxygen to return itself back into balance following exercise.
On paper, it sounds like a magic bullet, but in reality it is modest. Depending off how hard you push yourself during your intervals and how long they are, this boost will vary. For example, a shorter duration workout with little rest time may yield a greater EPOC response than an extended workout with plenty of recovery. So, the calculator factors that in too, allowing you to get a sense for all of the costs associated with your workout, both now and later. It’s a minor addition, but it really starts to add up when you train consistently week-in, week-out.
Not sure where to begin? Presets can help. Low-impact bodyweight circuits work differently (in terms of burn rate and load) compared to a Tabata bike workout. The page’s reference tables breakdown those types of workouts by their best use cases and typical metabolic equivalent. That way you has something to compare to before committing to your routine. Maybe you’ll discover rowing intervals produce a higher density score than walking sprints, which explains why one seems so much harder… Even though it lasts just as long.
How often you train also affects adaptation. Five a week produces different results than three both in terms of total burn and recovery needed. You should of tried this before. In short, HIIT is about doing enough to stress the system without breaking it. But it’s also about doing as much as possible in as little time as possible; not necessarily by doing more with less, but by working more efficient.
You get the framework from the numbers. You get the feedback from your body. Want to burn eight hundred calories? Cool. Feel like crap for three days afterward? Oops. Lower the effort rating next time, lengthen the rest interval between reps. The goal isn’t one heroic workout that sidelines you; it’s sustained intensity. As long as you balance the inputs with your actual feelings, the math becomes useful instead of abstract. That’s where the data become progress.