Heart Rate Drift Calculator
Estimate HR drift percent, pace or power decoupling, aerobic durability score, fueling and heat flags, and zone adjustment from first-half and second-half endurance test data.
❤Drift-Test Presets
Presets load common drift-test labels. Edit first-half and second-half HR, pace, power, duration, temperature, hydration, terrain, and sport to match the actual session.
⚙Calculator Inputs
Aerobic drift snapshot
Your HR drift, decoupling, durability, flags, and zone adjustment update as inputs change.
📊Metrics Grid
📑Drift Rules and Reference Tables
| HR drift | Label | What it usually means | Training response |
|---|---|---|---|
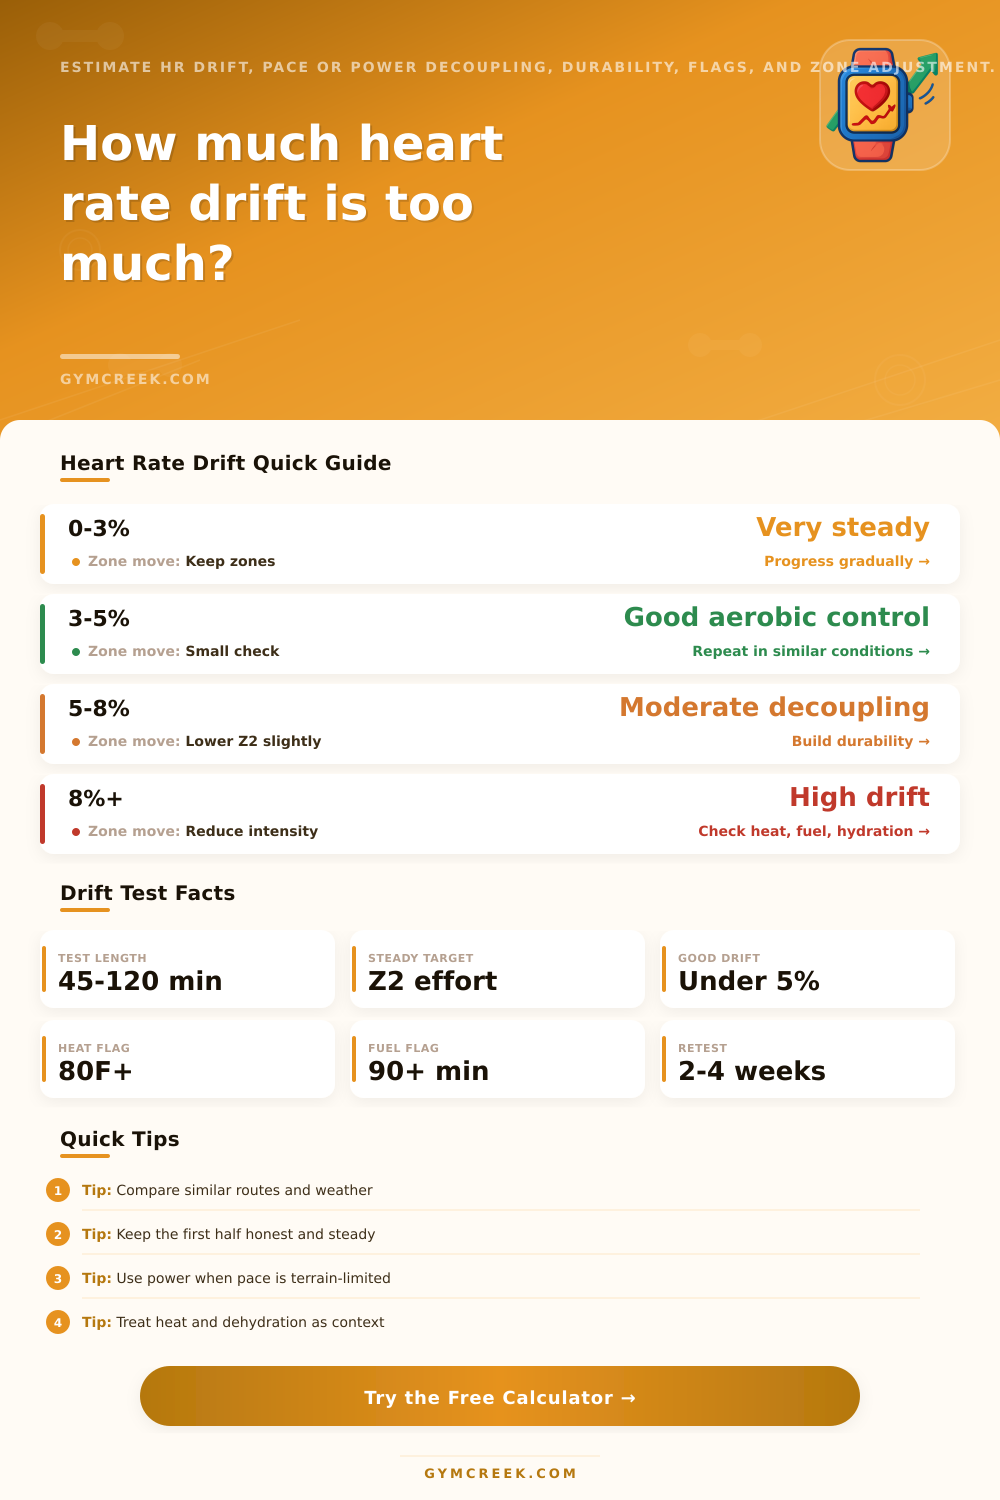
| 0 to 3% | Very steady | Strong aerobic control for the test conditions. | Keep easy zones and add volume cautiously. |
| 3 to 5% | Good control | Normal fatigue or mild environmental drift. | Repeat the test in similar conditions. |
| 5 to 8% | Moderate drift | Aerobic durability, pacing, heat, or fluids may be limiting. | Lower the easy cap slightly and build long steady work. |
| 8 to 12% | High drift | Likely decoupling or environment-driven cardiac strain. | Reduce Z2 target and check fueling and hydration. |
| 12%+ | Very high | The test may be too hard, too hot, underfueled, or too long. | Retest easier before moving zones upward. |
| Signal | Formula | Best use | Caution |
|---|---|---|---|
| HR drift | (Second HR / first HR - 1) x 100 | Simple cardiac drift view | Does not know if output changed. |
| Pace decoupling | ((Second HR x second pace) / (first HR x first pace) - 1) x 100 | Running on flat controlled routes | Wind, hills, footing, and stops distort pace. |
| Power decoupling | ((Second HR / second power) / (first HR / first power) - 1) x 100 | Cycling, indoor trainers, erg tests, and run power | Power meter smoothing and calibration matter. |
| Selected decoupling | Power if both halves have power; otherwise pace | Main calculator card | Use the notes to decide which signal to trust. |
| Flag | Trigger | Meaning | Adjustment |
|---|---|---|---|
| Fueling | 90+ minutes with 5%+ drift or 120+ minutes any drift | Carbohydrate availability may be limiting the second half. | Practice 30 to 90 g carbs per hour as tolerated. |
| Heat | 80F+ or large drift in warm conditions | Cooling and plasma volume can raise heart rate. | Retest cooler or lower pace/power target. |
| Hydration | Low intake, dry mouth, or 2%+ body mass loss | Fluid loss may inflate HR drift. | Use thirst, sodium context, and body-mass checks. |
| Terrain | Hilly, technical, windy, sand, snow, or trail | Pace decoupling may overstate fitness loss. | Prefer power, indoor test, or repeatable loop. |
| Output | Rule | Inputs used | Meaning |
|---|---|---|---|
| HR drift percent | Second-half HR divided by first-half HR, minus 1, multiplied by 100 | First HR, second HR | How much cardiac cost rose across the test. |
| Pace decoupling | Uses pace minutes and HR cost per speed; positive means higher HR for speed | Both paces, both HR values | Best for steady flat runs. |
| Power decoupling | Uses HR per watt; positive means higher HR for power | Both power values, both HR values | Preferred when valid power is present. |
| Durability score | Starts at 100, subtracts drift, decoupling, heat, hydration, terrain, duration, and sport-context penalties | All inputs | 0 to 100 practical endurance stability score. |
| Zone adjustment | Suggested cap reduction rises with drift, decoupling, heat, hydration, terrain, and poor durability | Drift, decoupling, context | How much to lower next easy/Z2 target. |
💡Tips
Heart rate drift occurs when the heart must work harder to maintain the same level of effort during a long exercise session. Heart rate drift can be measured during a steady exercise session, such as running or cycling. Heart rate drift is experienced when an individual feel that they can easily perform the first half of an exercise session, but experience increased effort during the second half of that exercise session.
This increase in effort indicates how the aerobic system is responding to long duration of exercise. To test for heart rate drift, an individual can divide an exercise session into two equal halves. The average heart rate for each half of the exercise session can be calculated.
What Is Heart Rate Drift and How to Test It
The average heart rate for the first half of the exercise session can be used as a baseline measurement for comparison with the average heart rate for the second half of the exercise session. Many people believe that a rising heart rate indicate a decrease in fitness. However, other factor that may cause a rising heart rate include heat or dehydration.
Other factors that may cause a rising heart rate during an exercise session include changes in terrain or fueling of the body. The calculator allow an individual to input the data from each half of the exercise session. Additionally, other variables related to the exercise session, such as the temperature during the session or the hydration status of the individual can be included in the calculator.
These variables are important in distinguishing between a five percent heart rate drift while performing an exercise session on a cool and flat course versus five percent heart rate drift during an exercise session on a hot and rolling course. The individual can adjust each of these variables using the calculator, which allows them to view how heart rate drift may change with those different variables. Drift testing can provide information that is different than that provided by a maximum heart rate test.
A maximum heart rate test can determine the maximum capacity of the heart, but it doesnt indicate how long an individual can maintain that level of effort. Drift testing, on the other hand, can indicate the extra cost to the heart of maintaining an effort that is below the maximum capacity of the heart for long period of time. This information can be used to determine if an individual’s easy zones for training are sustainable with their fitness level.
High heart rate drift indicate that an individual may need to lower their training zones to increase their durability. Context around the exercise session is another important factor in analyzing heart rate drift. Heart rate drift may occur when an individual is performing an exercise session in warm weather as the body works to increase blood flow to the skin.
Heart rate drift may also occur during a technical trail when changes in footing are experienced. The calculator may account for these variables, but an individual must also use their own judgement to account for these factors in addition to the calculators variables. An additional factor related to heart rate drift is the fueling of the body.
Long exercise sessions that last longer than ninety minutes can lead to heart rate drift due to low levels of carbohydrates in the body. Low levels of carbohydrates in the body can cause the body and heart to utilize less efficient fuel sources for the body to produce the same amount of energy. Individuals can reduce heart rate drift that result from low levels of carbohydrates in the body by adjusting the nutrition intake of the body during exercise sessions.
Athletes can utilize heart rate drift testing to adjust the nutrition plan of the athlete during exercise sessions as well as to monitor the aerobic durability of that athlete. The calculator can provide a durability score for the body based off the drift of the heart rate, as well as the context of the exercise session. A higher durability score indicates that the aerobic system of the individual remained stable during exercise.
A lower durability score suggests that there is some limiting factor to the individuals physical performance. The various variables entered into the calculator can adjust the durability score, allowing for the athlete to see how those variables may impact their aerobic system. Individuals should retest heart rate drift every few weeks.
The fitness level of an individual may change over time. The weather may change over time. The amount of rest that an individual gets may also change over time.
A high score for heart rate drift may suggest to the individual that they should of increase their training zones. A low score for heart rate drift may suggest to the individual that they should decrease their training zones. Either score is useful for athletes in determining their physical conditioning.
Heart rate drift is one data point that can be used to judge the conditioning of an individual’s aerobic system. Heart rate drift is just one data point to consider in addition to how the individual feels during their training zones and how they feel recovered between exercise sessions. Additionally, tracking the drift of the individuals heart rate over a long period of time will provide information that can be used to determine when to increase their exercise effort and when to hold their effort at the same level.