Growth Velocity Calculator
Annualize height change, compare the result with age-stage ranges, estimate mid-parent target height, and flag whether the measurement interval is strong enough to trust.
📌Presets
Presets load real measurement scenarios with different ages, stages, intervals, family heights, and unit systems.
⚙Calculator
Growth velocity snapshot
Enter two height readings to annualize growth pace.
📊Growth Metrics
🧮Metrics Comparison
📑Reference Tables
| Growth Stage | Typical cm/yr | Typical in/yr | Use |
|---|---|---|---|
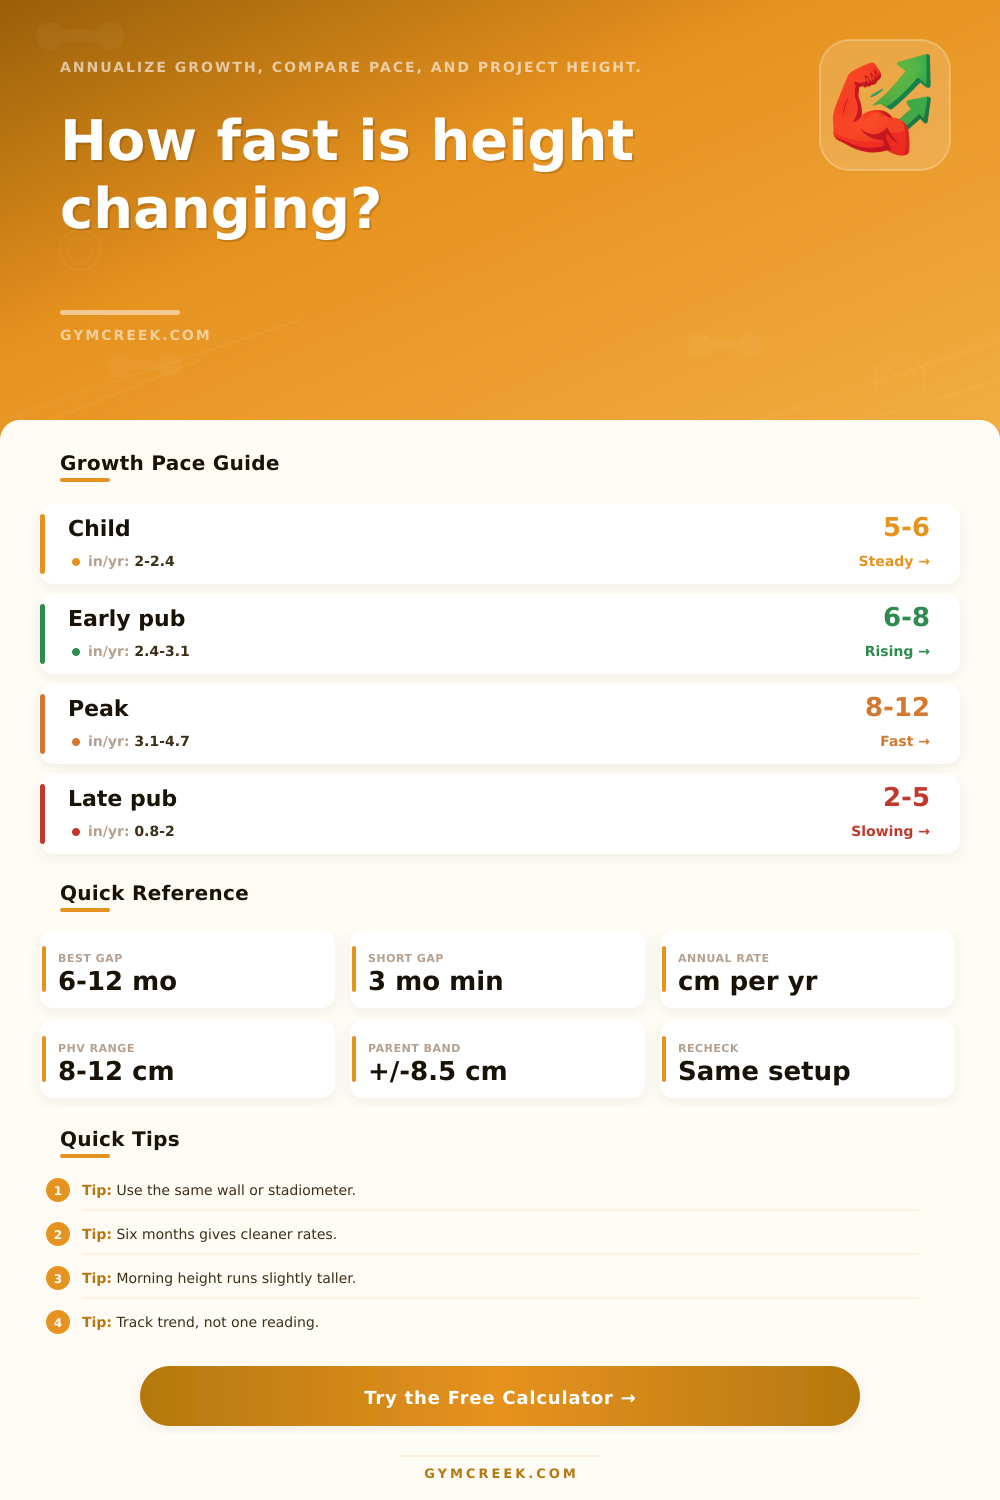
| Prepubertal child | 5-6 | 2.0-2.4 | Steady tracking |
| Early puberty | 6-8 | 2.4-3.1 | Acceleration |
| Peak height velocity | 8-12 | 3.1-4.7 | Fastest growth |
| Late puberty | 2-5 | 0.8-2.0 | Slowing pace |
| Interval | Reliability | Why It Matters | Action |
|---|---|---|---|
| Under 3 months | Low | Small errors dominate | Recheck later |
| 3-5 months | Fair | Trend is early | Confirm trend |
| 6-12 months | Strong | Cleaner annual rate | Good window |
| Over 12 months | Broad | May hide spurts | Split records |
| Measurement Setup | Expected Error | Best Practice | Note |
|---|---|---|---|
| Clinic stadiometer | Lowest | Shoes off | Head level |
| Same wall mark | Moderate | Hard floor | Repeat twice |
| Different sites | Higher | Use caution | Compare trend |
| Home tape only | Highest | Confirm later | Avoid carpet |
| Formula | Variables | Output | When To Use |
|---|---|---|---|
| Velocity | Height change, months | cm per year | Two readings |
| Mid-parent | Parent heights, sex | Target range | Family context |
| Projection | Current height, pace | 12 month height | Short trend |
| BMI | Weight, height | kg per m² | Context only |
💡Tips
Remember those days when your parents pulled out the tape measure and marked your height against the kitchen wall? That felt like some sort of ritual… But also data collection.
Most families is happy knowing just one number: how tall someone is today. Very few follow up to ask about the rate of change. They don’t ask how fast someone is growing or if that matches the expected rate for their age and stage of development. The rate of change are called growth velocity. As the speed limit on expansion of your skeleton, it’s far more important than just measuring your height on the chart. It shows us when a growth spurt might be coming, peaking, or nearing its end.
Why Growth Speed Matters More Than Height
The calculator up top will do all that math for you; you just need to enter your measurements and it’ll figure out the rest. No guessing required at coefficients or conversion factors; just pay attention to what the trend is doing.
People make another big mistake when measuring growth: they interpret any point in time as an absolute answer. Height changes during the day, as gravity compresses the spine. You’ll be taller in the morning, shorter at night. Your child could be measured right after school and seem to have grown rapidy. Then, if measured first thing in the morning, he might seem to have shrunk. It won’t be either of those things; it will simply be their posture combined with timing.
This is why length of time between each measurement matters so much. The sweet spot for annualizing a rate without getting drowned-out by daily noise is a 6-12 month gap. We all want instant gratification, which can tempt us into taking short-term measurements, but you really need at least three months for your data to separate reality from measurement error. The tool flags reliability by showing that your results becomes clear when you prioritize patience over how often you measure.
The numbers are easier to put into perspective once you understand what biology behind them means. For example, kids before puberty typically increase by about five to six centimeters a year, and you can easily predict the pattern even if you don’t pay attention to it much before it shifts. And then puberty comes along, and during the period of fastest growth, peak height velocity phase, growth doubles or triples. Girls see something like that (similarly intense, just a little earlier than boys), and boys experience bursts up to eight to twelve centimeters per year.
Knowing where your kid falls on that graph will help you not freak out needlessly. If a teenager is growing slowly but is already in late puberty, that slow pace is normal physiology, not a medical issue. But if he’s already through puberty, and growing more slowly, that slower growth is normal biology, not a medical problem.
The graphs built into the tool shows all this range. You can see how your child’s growth compares to how fast kids should of being growing based on their particular stage of development. There’s also a star for genetics, as in: knowing your parents’ heights can help put things into perspective when trying to estimate how tall your kid will get (though I know that doesn’t make it any less disappointing if you’re hoping for an NBA center). Typically kids will fall somewhere along the mid parent range, which means they are likely on track, even if they look shorter than other children who is at a different stage of growth.
That’s what the calculator calculates (using standard formulas); the range it places you in, sort of like a destination marker instead of merely a reading on a speedometer. It won’t tell you definitively whether your kid is going to grow up to 6 feet 8 inches tall, nor does it diagnose any medical issues. But it will offer a reasonable expectation grounded in family history. This can help prevent worry caused by comparing one child at the start of a growth spurt to another who is well past hers.
In the end, it’s a marathon of sprints. Don’t let one bad day at the doctor’s office throw you off course. Don’t take one reading and think you’ve got nothing. If you want to measure accuratley, consistency with the way you’re doing it is more important than perfecting anything. Try to measure at a similar time of day. Make sure you have bare, flat feet. Use the same mark on the wall. Those little things adds up to give you better data than you’d get from any luxurius piece of equipment alone.
You don’t need to worry about millimeters changing from week to week. It’s about seeing the pattern emerge over time. Step back and look at the process of growth as a collection of connected dots, not individual events. What did you use to mark that wall in your kid’s kitchen? It wasn’t the single line of pencil lead that mattered but the fact that those lines stacked up over time to share the story of growing up.