Grade Adjusted Pace Calculator
Convert a hilly or trail run into flat-equivalent pace using distance, finish time, elevation gain, elevation loss, surface, course profile, altitude, and split size.
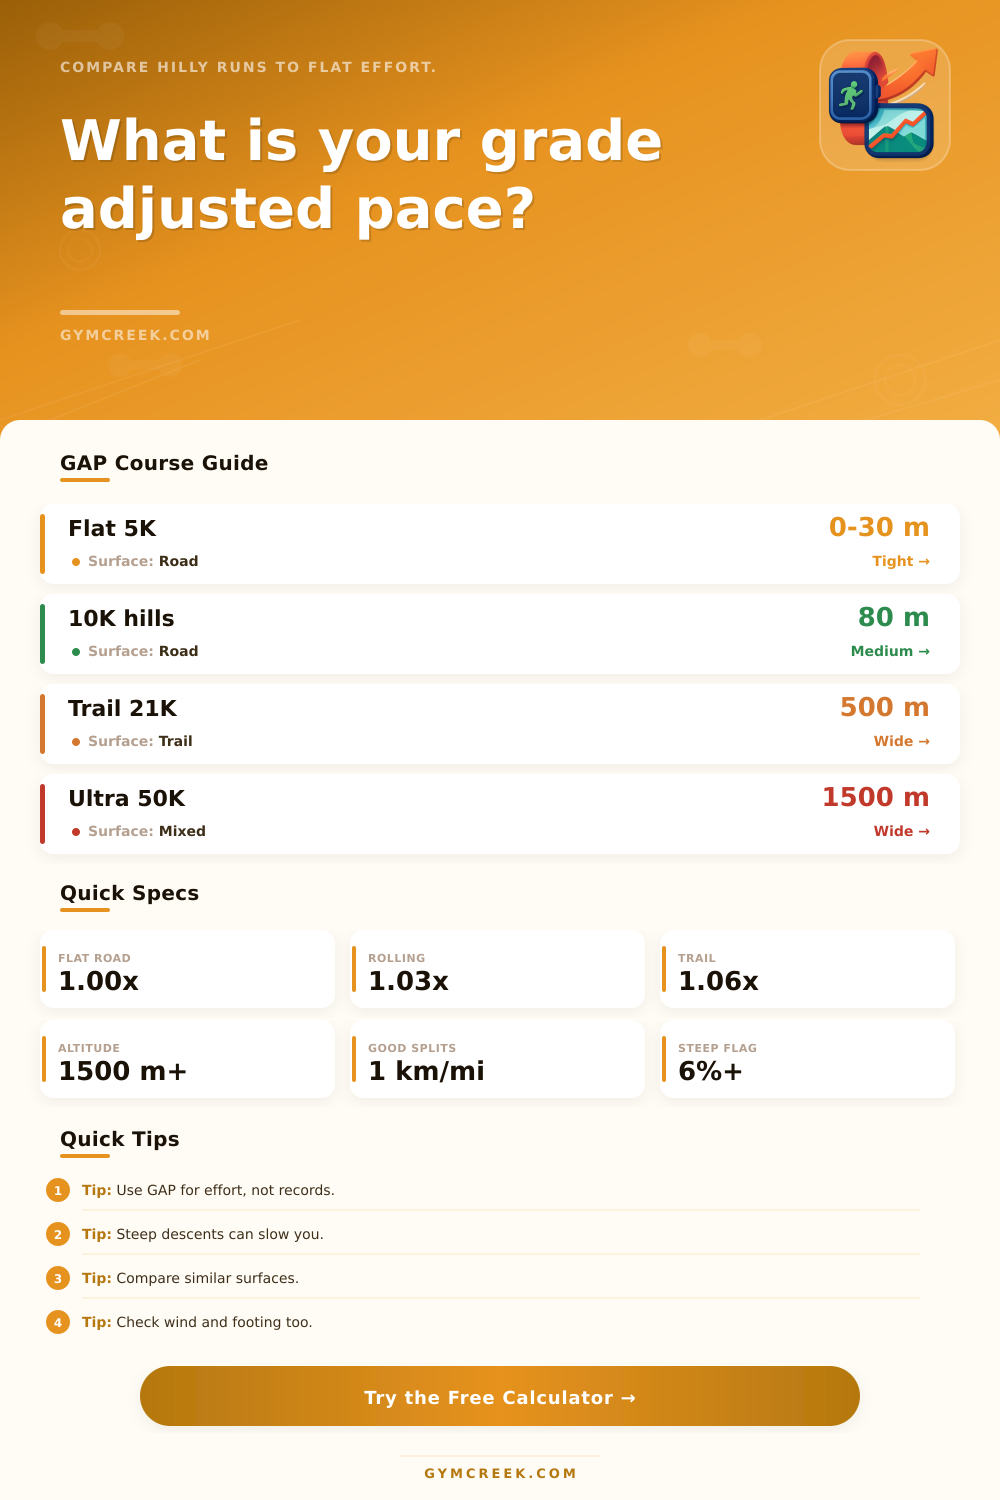
📌Real Course Presets
GAP estimates the flat-road pace that would require a similar effort. It is most useful for comparing workouts across routes, surfaces, and elevation profiles.
⚙Run Inputs
Run effort snapshot
Enter a route and time to estimate flat-equivalent pace, adjusted finish time, climbing cost, and course difficulty.
📊GAP Metrics Grid
📑Grade Adjusted Tables
| Split | Actual Time | GAP Time | Allowed GAP Range |
|---|---|---|---|
| --- | --- | --- | --- |
| Average grade | Typical effect | Use as | Watch cue |
|---|---|---|---|
| 0-1% | Small | Flat comparison | Normal pace |
| Condition | Factor | Adjustment | Reason |
|---|---|---|---|
| Road | 1.00x | 0% | Baseline |
| Signal | Meaning | Best use | Limit |
|---|---|---|---|
| GAP faster | Course slowed you | Compare effort | Not official |
💡Grade Adjusted Pace Tips
Runners seeking honest comparisons between routes don’t need raw pace to tell the whole story. A 10K over rolling roads in a park might take as long than a 10K along a flat river path, yet finishing them will feel like entirely different effort. That’s where grade adjusted pace comes in.
It translates difference into something useful by converting your hilly or technical outing into the equivalent flat-road pace that would of required the same effort. This way, you know if the workout actualy delivered what you intended.
Why Use Grade Adjusted Pace?
After plugging in a few environmental details plus your route’s distance, total elevation gain, surface type, and finish time, the calculator do all the math for you above. That’s because every input change how well your body turns your effort into forward motion. Extra work fighting gravity will slow you down on an uphill section, while a steep downhill eats some of that credit via impact and braking. Unstable footing and constant micro-adjusting to find good form cost you on technical trails and loose gravel, so surface selection is key too. Add altitude to the mix since less oxygen gets delivered when you rise above about 1,500 meters.
The tool rolls it all up into a single course factor that shows whether your pace was faster or slower then if you were running on a flat road. While some may use it for record chasing (most don’t), most runners instead use it to gauge day-to-day training progress.
Did you maintain last week’s easy, flat-loop pace today? Or was your grade-adjusted pace higher during your long uphill run because you are losing fitness? Was it lower? That’s what we want to know: if your grade adjusted pace is exactly where you would expect given the difference between flat and hilly terrain, then you didn’t hide behind elevation. But maybe your grade adjusted pace was much slower than expected, then maybe there’s something else going on.
Maybe it’s the softer ground underfoot; maybe it’s the wind; maybe it’s general fatigue that made it feel harder than it should have been based off the elevation profile alone. Those are the things the tool tells us through its reference tables of how different surfaces and grades tends to increase effort. But really, the power lie in comparing multiple runs over time and seeing trends, not individual numbers.
Treating downhill sections as an automatic freebie is a common mistake: while gentle descents can speed you up, steep or technical drops often require braking that increases effort and muscle damage. This is true on gentle slope. However, you’ll likely have to brake more on steeper, technical pitches. This will slow you down overall and increase muscle damage.
The profile settings in the calculator help lessen this by adjusting how much “credit” is given for elevation loss, but there’s always some wiggle room for judgment based on knowing yourself (your quads) and the trail conditions (how steep/technical/rocky/etc).
Another thing people often miss is consistent work throughout the whole route. For example, a route that has alternating hard climbs followed by recovery adds more cost over the total distance from just the average grade alone. The way the calculator does the split schedule enable you to see if your actual mile/kilometer times was within some reasonable band about the expected pace adjusted for grade. If they are out of that band, it’s typically because there was some change in conditions or pacing error, not something wrong with the adjustment.
Grade adjusted pace takes that gunked up route data and gives it meaning in a way that won’t replace the satisfaction of a good race or the feel of pushing yourself hard. But it will take away at least some of the guesswork if you’re wondering just how much one very different course really did ask of you versus another.