Force Velocity Profile Calculator
Estimate your load-velocity line, theoretical force, theoretical velocity, maximum power, and whether your current profile leans force-biased, velocity-biased, or balanced.
📌Presets
Presets load realistic gym testing data with two measured load-velocity points, then calculate the profile automatically.
⚙Calculator
Force-velocity profile
Enter two valid load-velocity points to estimate the profile.
📊Profile Metrics
📑Reference Tables
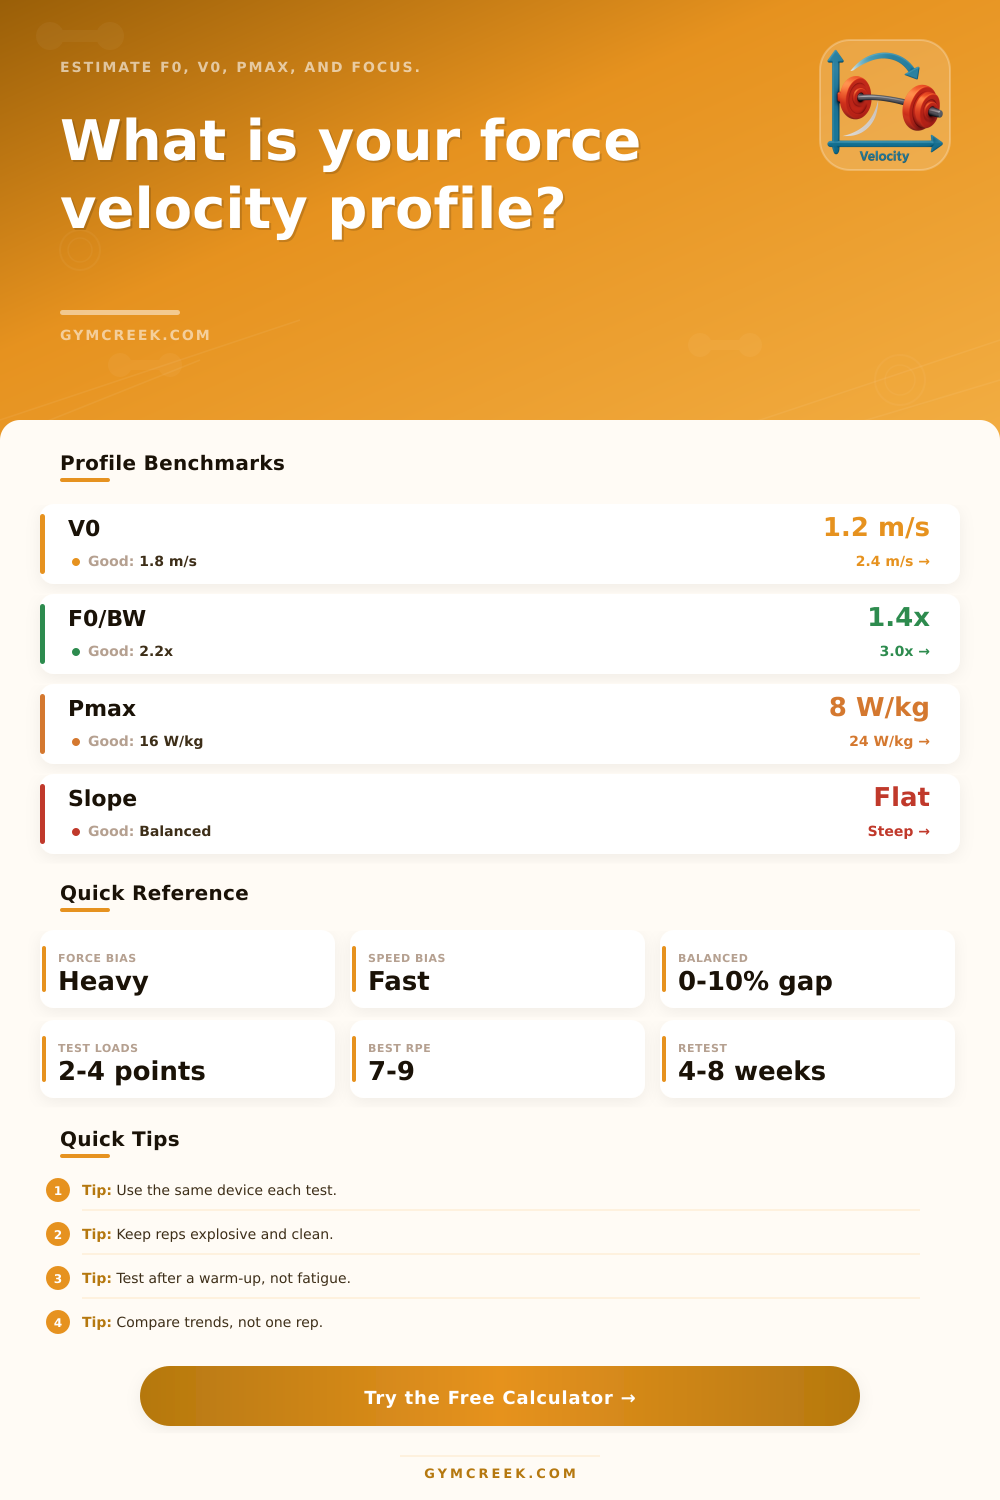
| Metric | Developing | Solid | High |
|---|---|---|---|
| F0 / BW | 1.4-1.8x | 1.9-2.6x | 2.7x+ |
| V0 | 1.0-1.4 m/s | 1.5-2.1 m/s | 2.2 m/s+ |
| Pmax / kg | 6-10 W/kg | 11-18 W/kg | 19 W/kg+ |
| Load slope | Flat | Moderate | Steep |
| Exercise | Typical MVT | Fast Zone | Heavy Zone |
|---|---|---|---|
| Squat | 0.30 m/s | 0.75-1.00 | 0.25-0.45 |
| Bench press | 0.15 m/s | 0.55-0.80 | 0.15-0.30 |
| Deadlift | 0.20 m/s | 0.60-0.90 | 0.20-0.35 |
| Jump squat | 0.70 m/s | 1.20-2.20 | 0.70-1.10 |
| Power clean | 0.70 m/s | 1.20-1.80 | 0.70-1.00 |
| Profile Read | Pattern | Common Meaning | Focus |
|---|---|---|---|
| Force deficit | High V0, low F0 | Fast but lacks ceiling | Heavy strength |
| Velocity deficit | High F0, low V0 | Strong but slow | Light speed work |
| Balanced | F0 and V0 aligned | Good power base | Peak power |
| Fatigue flag | Target speed drops | Readiness issue | Reduce volume |
| Formula | Variables | Output | Use |
|---|---|---|---|
| v = a + bL | Load, speed | Slope | Load line |
| L0 = -a / b | Slope line | Max load | Force limit |
| F0 = L0 x g | Load, gravity | Force | Ceiling |
| Pmax = F0V0/4 | F0, V0 | Power | Peak output |
💡Tips
A force velocity profiles can show how muscles performs if an individual move different amounts of weight at different velocities. Many people only consider the strength and speed of an athlete when describing there physical performance. However, the force velocity profile can provide a more in-depth and precision description of an athlete’s physical performance.
The force velocity profile shows the relationship between the amount of weight that is moved and the speed at which the load is moved. Using this graph, an individual can identify any weakness in their physical performance. The trade-off between the force and velocity of an athlete define how an athlete performs.
What is the Force Velocity Profile
If an athlete is performing movement with zero load, they can perform at the maximum velocity for that movement but produce minimal force. At the opposite extreme, if an athlete is attempting to move a load that is too heavy for that athlete to move, they will be producing the maximum amount of force but will have zero velocity in their movement. Every movement between these two extremes will define the athlete’s force velocity profile.
Using a calculator, an individual can determine where they sit on this force velocity profile spectrum without having to plot the data on a graph. To determine an athlete’s force velocity profile, an individual must measure the velocity of their movement with both a light and heavy loads. For this measurement, the athlete will measure the mean concentric velocity of the repetitions.
If the athlete moves a moderate load at a speed that is roughly equal to the velocity with which they moved the lighter load, they will have a flatter slope on their force velocity profile. A flatter slope indicate that an athlete has explosive strength. If an athlete experiences a significant drop in the velocity of their movement when increasing the load of the barbell, they will have a steeper slope on their force velocity profile.
While many people may believe the one-repetition maximum (1RM) is the most important strength measurement, the rate at which the athlete’s velocity decline with the load is more indicative of their 1RM and training needs. Within a force velocity profile are two metrics: F0 and V0. F0 represent the maximum amount of force an athlete can produce regardless of the speed at which they move the load. V0 represents the maximum velocity with which an athlete can move the load regardless of the load.
If an athlete has high values for F0 but low value for V0, they are force-biased. Force biased means that an athlete has high strength but poor speed. If the athlete has high values for V0 but low values for F0, they are velocity biased.
Velocity biased indicates that an athlete has high speeds but low strength. By using the training focus metric, an athlete can determine whether they should be performing heavy repetitions to increase their F0 or if they should be performing light, explosive movements to improve their velocity. On the page are reference tables to compare the athlete’s metrics with general benchmarks.
The metrics used in these tables are the power an athlete produces per kilogram of there body weight. Comparing an athlete’s power output per unit of body weight is crucial to understanding there strength. A 500-watt output is significantly different for a 150-pound athlete then it is for a 300-pound athlete.
To compare physical performance fairly, the power output metrics must be scaled to the body mass of that individual. Another concept within a force velocity profile is the minimum velocity threshold, or MVT. The MVT differ for each exercise due to the different movements required to perform that exercise.
Bench press exercises will have higher MVTs than exercises like jump squats. By knowing the MVT of an exercise, an individual can estimate their 1RM for that exercise. This estimate will allow an individual to track their 1RM without risking the fatigue that can develop when performing an exercise to failure.
Another way to monitor an athlete’s force velocity profile is to track their fatigue over time. If the target velocity that an athlete produce for a specific load declines over time, this can indicate the development of central nervous system fatigue. While the athlete can still perform the movements with the prescribed load, the decline in velocity indicates a loss of the ability to recruit high threshold motor units.
If an athlete experiences a loss of velocity for their movement, they should reduce the volume of their training. To collect the data required for an athlete’s force velocity profile, the athlete should perform as many repetition as possible with high intent and with proper technique. If the athlete performs any sloppy movement with a slow start, it will skew the value of V0. To ensure that an athlete’s force velocity profile reflect the true physical performance of that athlete, all repetitions should be performed to the best of their ability.
Finally, an athlete should not obsess over their theoretical maximum velocity for any exercise. The theoretical maximum velocities are merely estimates of an athlete’s physical performance. An athlete should focus on the direction of the shift in their force velocity profile.
For instance, if an athlete increases their strength with heavy repetitions for twelve week, their F0 should increase, and their V0 should remain the same. The athlete’s goal is to increase both measures to gain both strength and speed.