Foot Strike Rate Calculator
Estimate total and per-foot strike rate from cadence, then connect ground contact time, pace, stride length, strike pattern, terrain, shoe type, grade, and fatigue into a practical running mechanics snapshot.
📌Named Foot Strike Presets
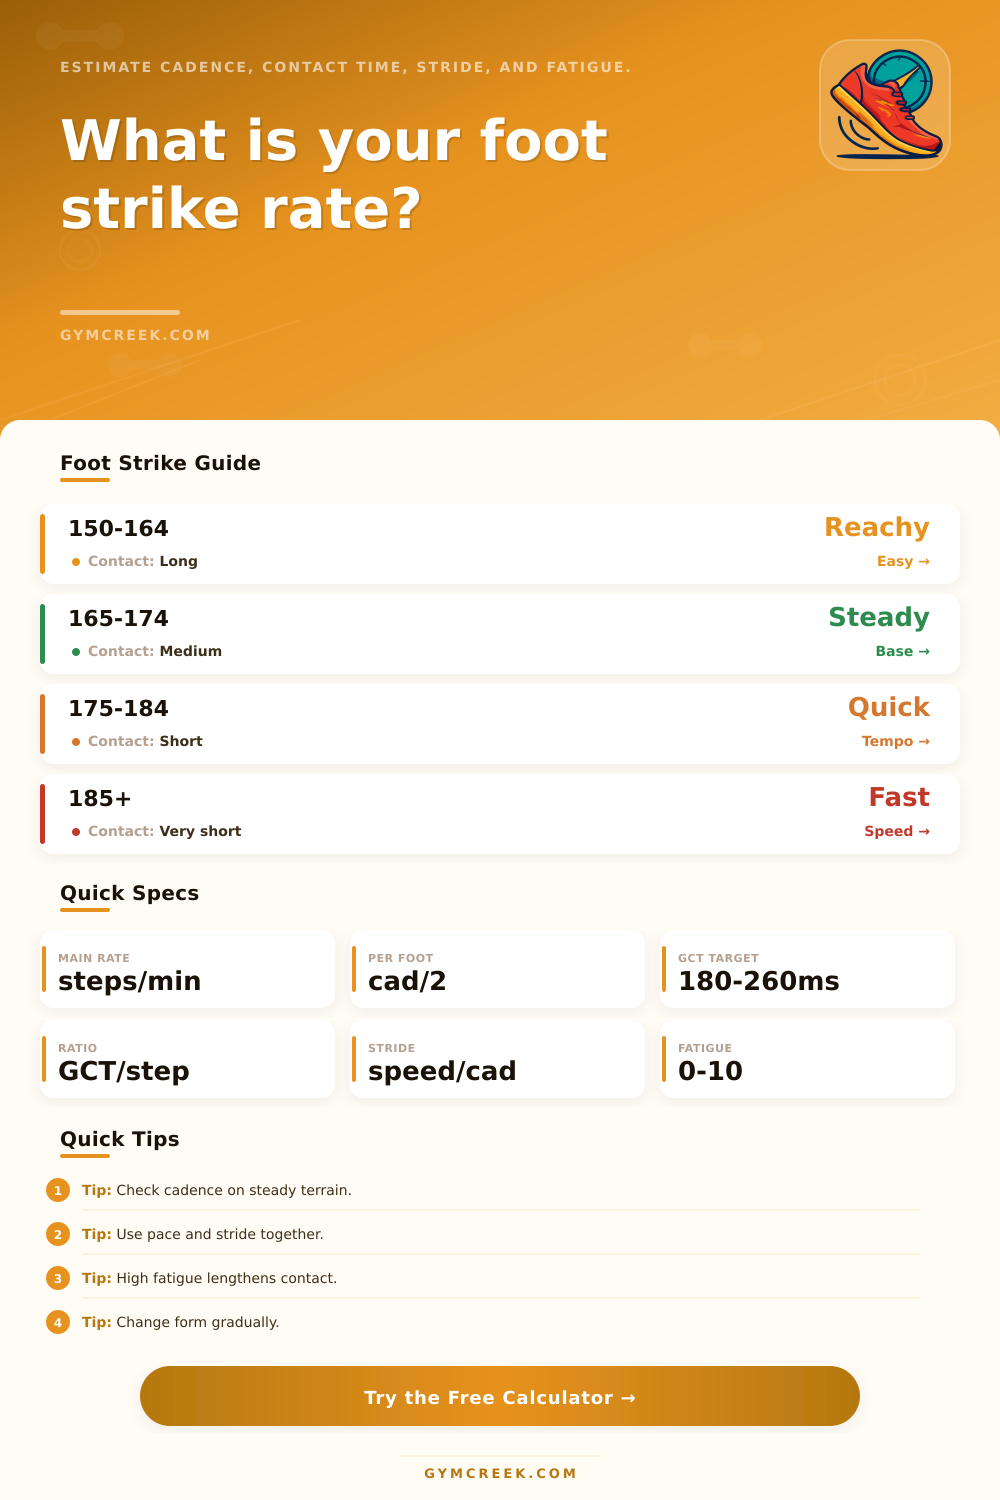
Foot strike rate is usually the same as step cadence: total foot contacts per minute. Per-foot contacts are half the cadence.
⚙Running Inputs
Foot strike snapshot
Enter cadence, contact time, pace, stride, terrain, shoe, and fatigue to calculate the mechanics profile.
📊Foot Strike Metrics Grid
📑Foot Strike Tables
| Component | Input | Formula / Factor | Result |
|---|---|---|---|
| Cadence | --- | --- | --- |
| Band | Cadence Range | Contact Pattern | Common Context |
|---|---|---|---|
| Long step | 150-164 spm | Often longer contact | Easy pace, hills, tall runners, fatigue |
| Steady | 165-174 spm | Balanced contact | Base running and relaxed endurance |
| Quick | 175-184 spm | Shorter step time | Tempo, efficient cruising, light shoes |
| Speed | 185+ spm | Very short step time | Intervals, racing, track work, drills |
| Input | Typical Effect | Calculator Use | Watch Signal |
|---|---|---|---|
| Rearfoot pattern | Often stable at easy pace | Slightly higher contact score | Large overstride gap or braking feel |
| Forefoot pattern | Often shorter contact | Higher calf demand score | Calf fatigue and pace drift |
| Soft or loose surface | Longer contact | Adds terrain load | Cadence drop with same effort |
| Plated or light shoe | May quicken turnover | Small response adjustment | Stride feels forced or bouncy |
| Fatigue Score | Likely Change | Cadence Cue | Practical Note |
|---|---|---|---|
| 0-2 | Fresh mechanics | Use natural rhythm | Collect baseline data |
| 3-5 | Small contact drift | Hold relaxed turnover | Compare against normal runs |
| 6-8 | Longer contact likely | Avoid reaching forward | Reduce intensity if form collapses |
| 9-10 | High fatigue signal | Keep changes tiny | Prioritize recovery and coaching input |
💡Foot Strike Tips
Cadence refers to number of foot strikes per minute. The only reason you care about that is if you relate it to something else. For example, what does it mean? What is its value on a particular day? That depends off your gait, your running form, your pace, your stride length, the type of surface underfoot, footwear, and fatigue. It’s different every single day.
Combine them all into one figure with a foot strike rate calculator. No need to crunch numbers after every run.
How Cadence Changes With Your Run
Most people will notice that cadence change depending on the conditions. If they are on a flat road, running easy, it’ll average out to about 170 steps per minute. When they put themselves up against a technical trail, that runner may drop down to about 160 steps per minute. This takes that into account. You can input your measured cadence along with the terrain and the calculator will account for the difference, rather than assuming every surface are the same.
It will also factor in the specific shoe worn; a more cushioned trainer will typicaly extend contact a bit longer then a lightweight tempo shoe.
The other key element is ground contact time. Even though two people might have the same cadence, they may be in contact with the ground more or less time per footfall. Contact time correlates to less flight time. Typically this result in having a shorter stride length while maintaining the same speed. The tool will allow you to input both cadence and contact time.
Does your stride land where you expect? Are you chopping steps? Or are you overstriding? There’s also layer of fatigue. Even with a steady pace, contact time can creeps up as the effort accumulates. Because of this, there is a spot in the calculator to enter fatigue. Compare a run where you’re fresh to a run where you’re tired and you’ll see when your mechanics begin to drift. More important than any single number is that comparison. Is it normal for you? Or is it a sign that form is beginning to break down?
The same applies for stride length, which is either entered directly or automaticly determined by entering pace and cadence. To make it interesting, however, this number needs to be compared to your actual body height and, ideally, to the stride predicted by your pace. If there’s a big discrepancy between stride length as measured versus stride length as calculated from pace, then you’ve probably been pushing yourself too hard. Or maybe you just ran into some new terrain and your legs hasn’t adjusted to it yet.
How does it do that? The tool’s reference ranges aligns observations with how cadence and contact time typicaly move together during various types of effort. From interval to recovery jog, this range has it all. The bands aren’t rules to be followed. Think of them as a handy indicator for where your numbers falls outside of what you’re used to seeing on similar runs.
The watch data is scattered, but over time the calculator turn it into a continuous record of form. And it’s not just pace data. You’ll discover what input shifts first as you tire out. What terrain requires largest adjustments. Which shoe maintain your contact time? That pattern recognition allows you to make small, informed tweaks. This avoids guessing at form changes that might not address the problem.