Fluid Loss Percentage Calculator
Estimate exercise fluid loss percentage from pre-session weight, post-session weight, drinking, urine output, duration, weather, intensity, and athlete profile.
📌Fluid Loss Presets
Use consistent weigh-in conditions: dry towel-off, similar clothing or no clothing, same scale, and a short delay between finishing and the post-session weight.
⚙Fluid Loss Inputs
---
---
📊Hydration Metrics Grid
📑Fluid Loss Reference Tables
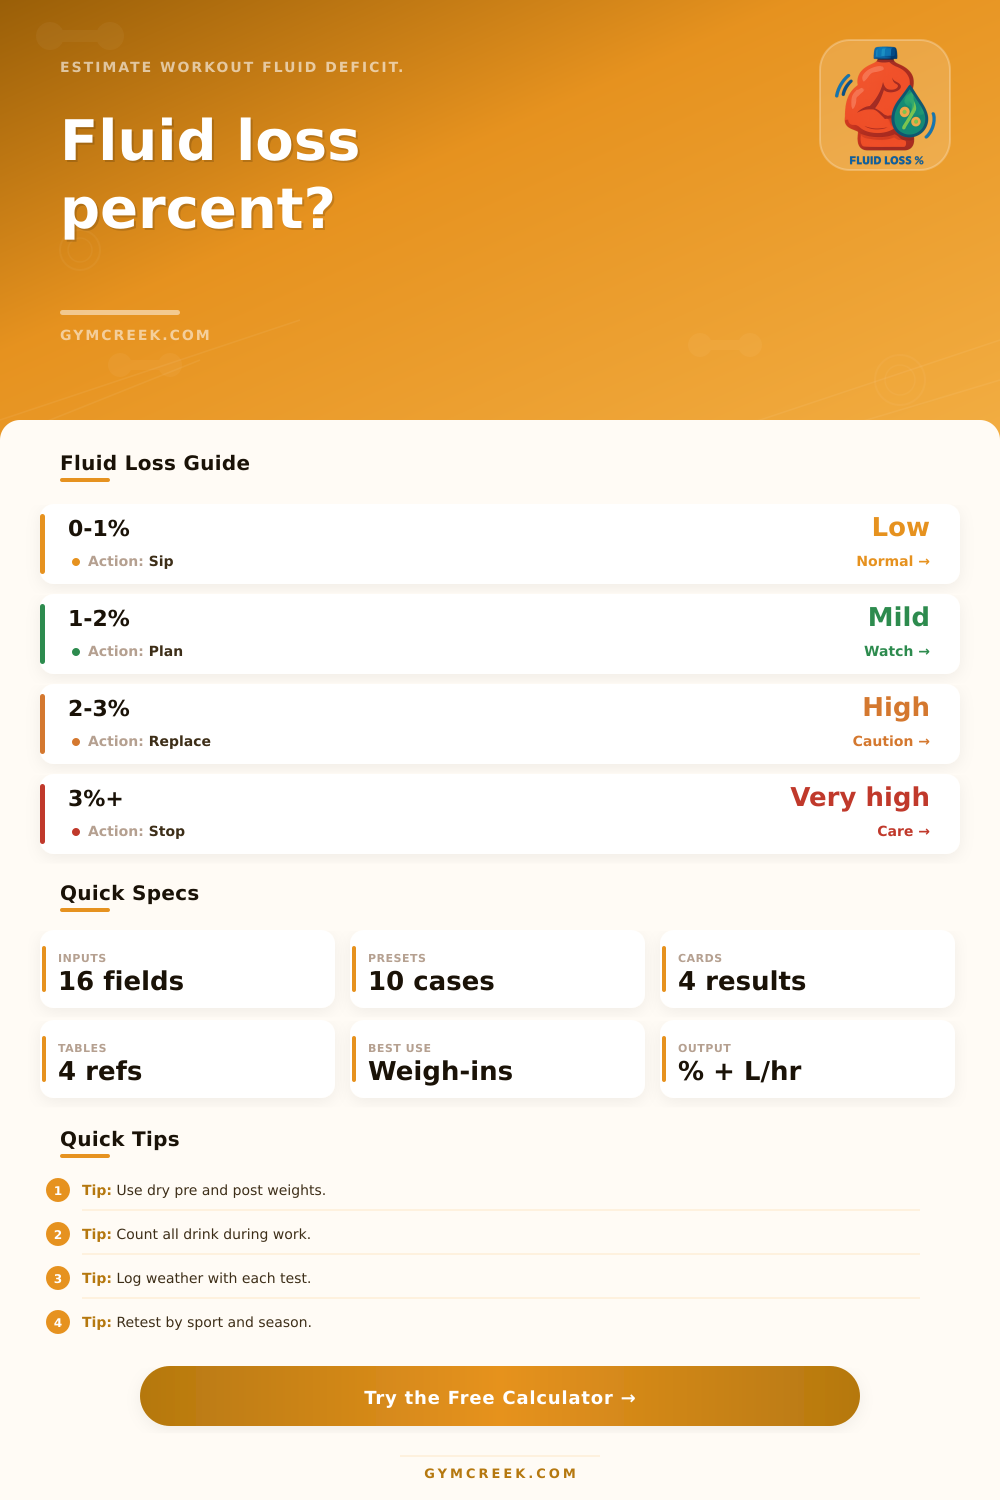
| Loss % | Signal | Common Cue | Action |
|---|---|---|---|
| 0% to 1% | Low | Usually manageable | Keep pattern |
| 1% to 2% | Mild | Performance may drift | Review intake |
| 2% to 3% | High | Heat strain rises | Plan recovery |
| 3%+ | Very high | Session was costly | Use caution |
| Rate | Liters/hr | Fl oz/hr | Typical Setting |
|---|---|---|---|
| Low | 0.3-0.7 | 10-24 | Cool easy work |
| Moderate | 0.7-1.2 | 24-41 | Steady session |
| High | 1.2-1.8 | 41-61 | Heat or tempo |
| Very high | 1.8+ | 61+ | Heavy heat load |
| Output | Formula | Inputs | Use |
|---|---|---|---|
| Scale change | pre - post | weights | Raw loss |
| Net deficit | loss - urine | kg, L | Body deficit |
| Gross fluid | loss + drink - urine | kg, L | Total loss |
| Fluid rate | gross / hours | L, time | Planning |
| Recovery | deficit x factor | L, goal | 2-4 hr target |
| Measure | Value | Per Hour | Training Use |
|---|---|---|---|
| Fluid loss | --- | --- | --- |
💡Fluid Test Tips
After a long period of training, tiredness can simply be due to lost fluids. Your body has less water than it needs, because you have given up more then you have put back. That’s not some fuzzy feeling but a precise measurement: the difference between your body weight at the beginning and end of exercise minus any water added (by drinking) or subtracted (as urine). That number tell you exactly how much performance you gave up to heat stress, and how much you must recover before hitting the pavement anew.
Most folks follow one side of the above equation. They log how much they drink in. Then figure that’s enough to make up for what they lose. But we know: Sweat rates is affected by altitude, clothing, effort, humidity, and temperature. That means if a runner consumes the same quantity during an afternoon session as they do in the early morning on a cool day, they will have different deficits at the finish.
How to Track Your Water Balance for Better Performance
Once you input all your workout conditions (along with any fluid consumed or body weight before/after) into the calculator, it account for those differences. It gives you both the total deficit and the hourly rate of loss so you can better plan future workouts. It informs real-time choices: losing >1L/hr? Replacing <0.5L/hr? That’s a flashing sign. Adjust your output (intensity, time, gear) to decrease heat load or increase fluid access.
It informs your recovery plan too. After an easy day with a minor deficit, keep sipping and eat normaly. After a double training or race rehearsal day with a bigger deficit, drink steadily over several hour instead of all at once after your session. That’s why the tool takes those raw percentages and puts them into planning categories (referring to ranges for each value). You can typically handle one percent. But if the heat load score is high, then you can’t handle a three percent loss. The tool calculates your clothing, effort, altitude, humidity and temperature all into a single score which allows you to compare a day of training to another. That score make it easier to tell if a workout was especially taxing, even more so than last week when it was just hotter.
Perfect isn’t as good as consistent. Use the bathroom before weighing yourself and do it on the same scale every time. Write down how much water you realy drank (as opposed to how much you hauled in). Remember to record average temp, not the high one. All these practices filter out noise. This noise otherwise makes two similar sessions seem like they were two entirely different sessions.
Weeks later, a pattern becomes evident. Rather than shooting for some imaginary number, you know your own personal range within a given season/sport. That’s the reasoning behind recovery planning too. You multiply your daily goal by a certain number. If it’s just a regular training day then use a small multiplier. If it’s a back-to-back or a race rehearsal day then use a higher multiplier since your body should of been mostly hydrated prior to the next effort. It’s not a prescription. Instead, it will give you a range to test against your urine color, thirst, and fullness in the coming hours.
So there’s your main takeaway: Fluid balance isn’t a one-off decision made at the end of a training session; it’s a loop beginning with the pre-session weigh-in and ending with the weigh-in preceding the following session. Close the loop in consistent conditions. What was once a surprise, a percentage… Becomes something predictable. You can now use this information to improve recovery and performance.